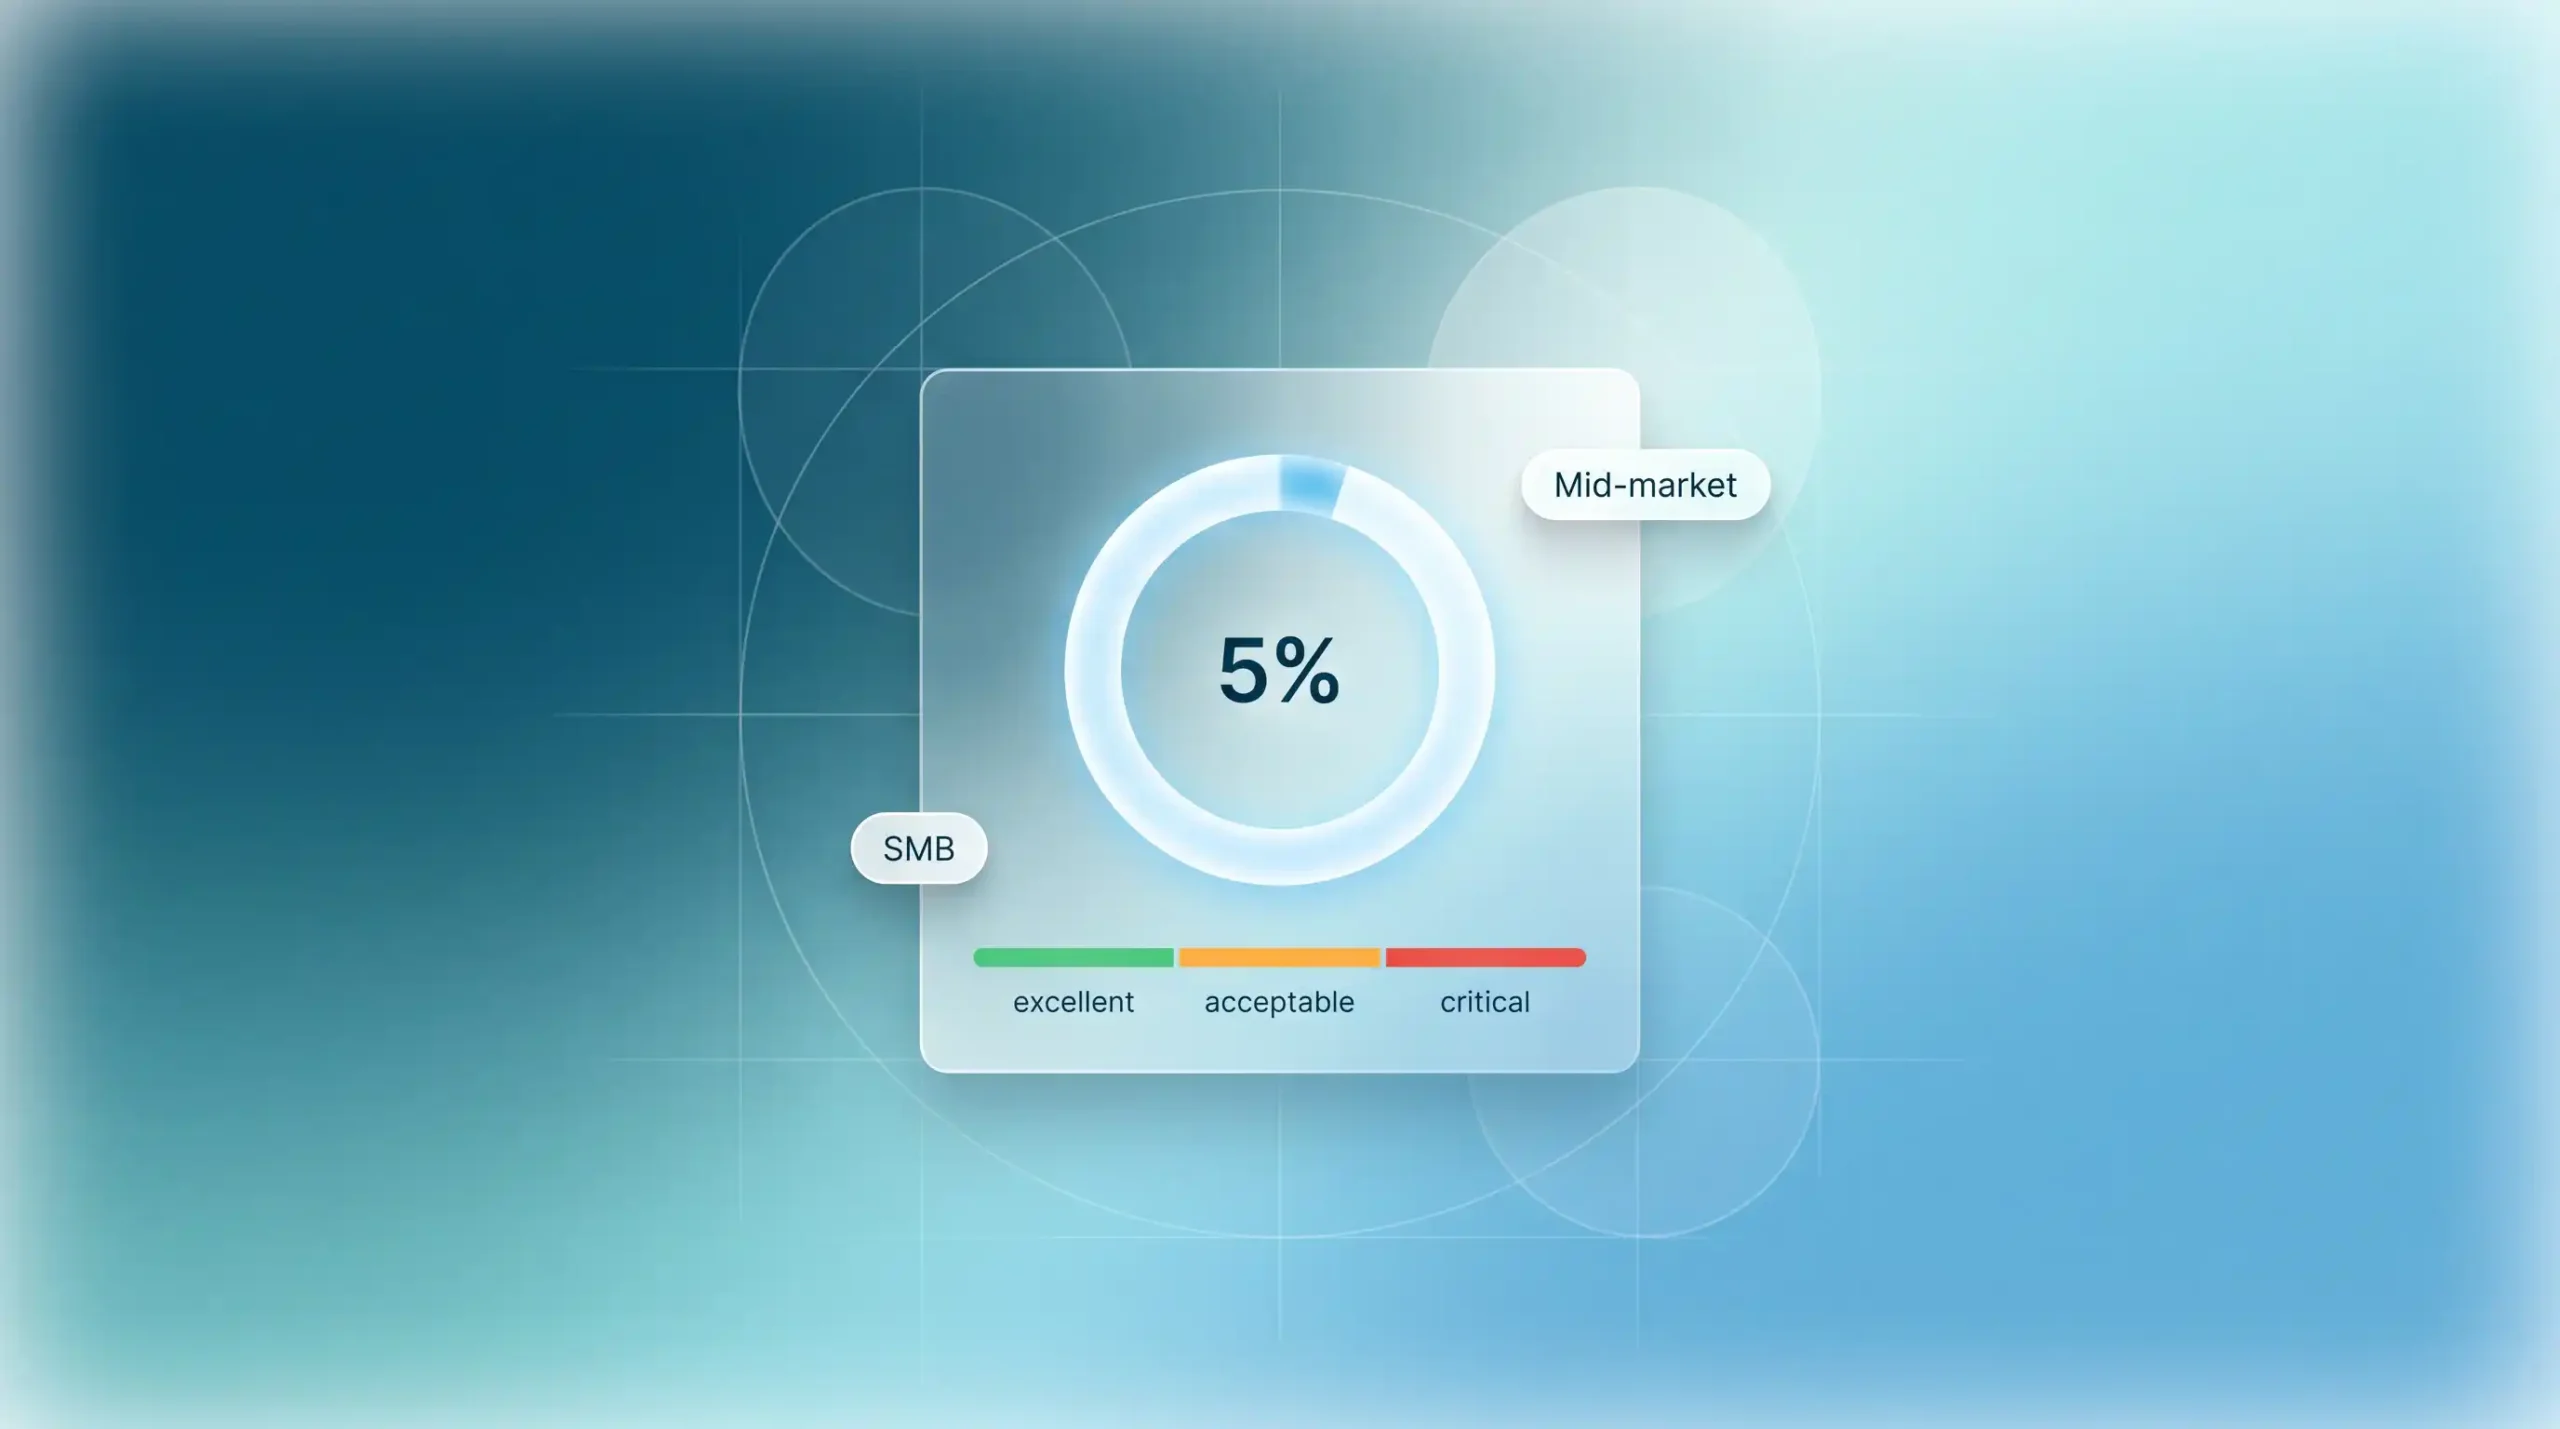
Your monthly churn rate is 5%. Is that disastrous, normal, or excellent?
Without a point of comparison, this metric is meaningless, because the average churn rate for a SaaS company depends on your customer segment, your industry, your pricing model, and your stage of growth.
This guide provides concrete, actionable benchmarks to help you assess your churn rate and determine when to sound the alarm.
1. Average SaaS churn rate: Key figures for 2026
The average global churn rate: between 5% and 7% per year
The most frequently cited figure in the SaaS industry: the average annual churn rate ranges between 5% and 7% across all companies, regardless of segment or sector. This data comes from several meta-analyses of the SaaS market, notably from Cobloom, which aggregated the results of six sector-specific studies.
But this overall average is misleading. A B2B SMB SaaS company and an enterprise SaaS company operate in completely different worlds. Comparing your churn rate to this average without taking your specific profile into account is like comparing the speed of a scooter to that of a high-speed train just because both travel on French territory.
The real question isn’t “Is my churn rate in line with the overall average?”, but “Is my churn rate normal for my segment, stage, and industry?” That’s what the benchmarks below help determine.
Monthly vs. annual: don’t confuse the two metrics
One of the most common mistakes is confusing monthly churn with annual churn. A monthly churn rate of 5% does not equate to an annual churn rate of 60% (5% × 12), but rather to approximately 46%, because the customer base shrinks each month.
The correct formula: annual churn = 1 – (1 – monthly churn)^12. In practice:
- 1% monthly churn = 11% annual churn
- 3% monthly churn = 31% annual churn
- 5% monthly churn = 46% annual churn
- A monthly churn rate of 7% equals an annual churn rate of 58%. That means more than half of the customers are lost within a year.

When reading a benchmark, always check whether it refers to monthly or annual churn. Confusing the two completely skews the analysis.
Why these averages are misleading without context
The average churn rate for SaaS ranges from 1% to 20%, depending on the company’s profile. An enterprise SaaS offering with multi-year contracts and an ARPA of $50,000 per year is nothing like a self-service SMB SaaS offering at $29 per month. Comparing their churn rates makes no sense.
Three factors determine what is “normal” for your SaaS business: your customer segment (SMB, mid-market, enterprise), your industry, and your stage of growth. The following sections detail the benchmarks for each.
To fully understand the different types of churn before comparing them, check out our comprehensive guide to churn, attrition, and unsubscription.
2. Benchmarks by customer segment
SaaS for SMBs (fewer than 50 employees): between 3% and 7% per month
The SMB segment is structurally the most vulnerable to churn. Small businesses are more volatile: they have tight budgets, make quick decisions, are highly price-sensitive, and have low switching costs. A founder who is dissatisfied can switch to a different tool within a week.
| Level | Monthly churn | Annual churn | Interpretation |
| Excellent | < 1% | < 11% | Top 10% of the market |
| Okay | 1 to 2% | 11% to 22% | Good retention |
| Acceptable | 3 to 5% | 31% to 46% | Average |
| Review | > 7% | > 58% | Warning signal |
In the SMB sector, a monthly churn rate of less than 2% places your SaaS among the top 25% of performers. This is achievable with effective onboarding, a product that delivers on its promises, and a system for early detection of at-risk customers.
Mid-market SaaS (50 to 500 employees): between 1% and 3% per month
The mid-market segment enjoys greater stability: customers have more structured processes, more predictable budgets, and higher switching costs (integration, team training, internal processes). Churn is inherently lower in this segment.
The target for the mid-market: less than 2% monthly for growth-stage companies, and less than 1% for more mature SaaS companies. If the monthly churn rate exceeds 3%, that’s a red flag: something isn’t working in terms of the value delivered or the customer experience.
Enterprise SaaS (more than 500 employees): less than 1.5% per month
In the enterprise sector, churn is structurally low for two reasons: contracts are often annual or multi-year (which automatically delays opportunities for termination), and switching costs are massive (extensive technical integrations, training, and organizational dependencies).
The enterprise benchmark: less than 1.5% monthly is the norm, and less than 0.5% monthly is considered excellent. If your enterprise churn exceeds 2% monthly, this is a serious warning sign indicating either a product issue or a mismatch with the segment’s expectations.
3. Industry benchmarks
Sectors with low churn (HR, finance, payroll)
Certain sectors experience structurally high retention rates because their tools are central to critical business processes. Switching payroll software or HR tools involves months of migration and significant operational risks.
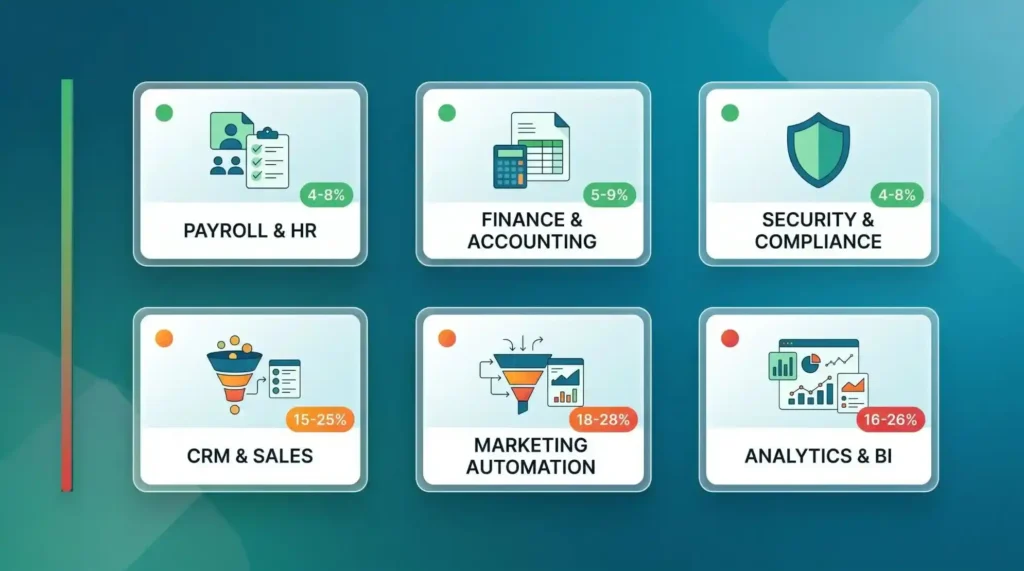
- Payroll and HR software: average annual churn rate of 4% to 8%
- Billing and accounting tools: average annual churn rate of 3% to 7%
- Security and compliance: average annual churn rate of 4% to 8%
Sectors with moderate churn (CRM, collaboration tools)
CRM and collaboration tools have moderate switching costs: high enough to slow down the decision to switch, but not high enough to prevent it if a competitor offers a clearly better solution. Churn in this context is influenced by product quality and the onboarding experience.
- CRM and sales tools: average annual churn rate of 8% to 15%
- Collaboration tools and project management: average annual churn rate of 10% to 20%
- Helpdesk and customer support: average annual churn rate of 7% to 12%
Sectors with high churn rates (marketing, analytics, creative tools)
Marketing and analytics tools suffer from structurally high churn: a highly competitive market, low switching costs, and customers who test multiple solutions simultaneously. The perceived value must be clearly demonstrated to justify renewal.
- Marketing automation tools: average annual churn rate of 15% to 25%
- Analytics and BI: average annual churn rate of 12% to 20%
- Creative and design tools: average annual churn rate of 15% to 30%
4. Benchmarks by growth stage
Early stage (0 to 50 customers): High churn is normal
In the early stages, a monthly churn rate of 5 to 10% is common and doesn’t necessarily mean your product is bad. You’re still searching for your product-market fit, you’re acquiring customers outside your ideal customer profile, and your onboarding process is often incomplete.
What matters at this stage isn’t achieving zero churn, but understanding why your customers are leaving. Every cancellation is a learning opportunity. The goal is to get the monthly churn rate below 5% before moving on to the accelerated growth phase.
Growth (50 to 200 customers): aim for less than 3% per month
During the growth phase, churn becomes a critical metric. With 150 customers paying $99 per month and a monthly churn rate of 5%, you lose 7 to 8 customers per month, meaning you need to acquire 7 to 8 new customers just to maintain your MRR. It’s a never-ending cycle.
The goal during the growth phase: to reduce monthly churn to below 3% for mature customer cohorts (with a tenure of more than 6 months). This is the threshold at which your growth becomes truly scalable.
To automate detection at this stage, check out the best anti-churn tools for SaaS in 2026.
Scale (200+ customers): Net revenue churn as a guide
Once you have more than 200 customers, gross churn is no longer the only relevant metric. Net revenue churn (MRR churn minus MRR growth) becomes the primary indicator. If your revenue growth from your existing customer base exceeds your revenue churn, your net revenue churn is negative: your existing customer base is growing on its own.
The most successful SaaS companies at this stage aim for a net revenue churn rate of -5% to -15% annually. This is achievable with a solid growth strategy (upsells, additional seats, add-on modules) and well-managed gross churn.
5. Factors that affect your average churn rate
The pricing model (monthly vs. annual)
The billing cycle is one of the most powerful factors influencing churn. Annual subscriptions automatically reduce churn by eliminating monthly cancellation windows. On average, SaaS companies with a high proportion of annual subscriptions have churn rates that are two to three times lower than those of their monthly-billed counterparts.
In practical terms: if your current mix is 80% monthly / 20% annual, switching to 50% annual could be enough to cut your churn rate in half, without changing a single line of code. This is often the quickest lever to pull.
ARPA: the higher it is, the lower the churn rate
The correlation between average revenue per user (ARPA) and churn is one of the strongest in the SaaS industry. Data from ChartMogul shows that SaaS companies with an ARPA of more than $1,000 per month have, on average, a churn rate that is 3 to 5 times lower than those with an ARPA of less than $100 per month.
There are two explanations: first, customers who pay more have invested more in the tool (training, integrations, processes) and therefore face higher switching costs. Second, customers with high ARPA are often larger companies, and thus more stable and less sensitive to budget fluctuations.
The company’s history
Churn naturally decreases over time. SaaS companies that are less than a year old often have annual churn rates exceeding 15%, as they have not yet achieved product-market fit and are acquiring customers outside their ideal customer profile. SaaS companies that are more than three years old generally see their annual churn rates drop below 10%, and those that are more than seven years old fall below 5%.
It’s not inevitable, it’s simply part of the learning process. Each quarter, you gain a better understanding of why your customers stay or leave, and you make adjustments accordingly.
6. Is my churn rate average? How can I tell?
3 Questions to Ask Yourself Before Comparing
Before comparing your churn rate to a benchmark, ask yourself these three questions:
- What is my primary customer segment? SMB, mid-market, or enterprise? A monthly churn rate of 4% is excellent for SMBs, but disastrous for enterprises.
- Am I comparing monthly figures to monthly figures? Always make sure you’re comparing the same time period. Many benchmarks report annual churn, not monthly churn.
- What is my primary type of churn? If 40% of your churn is involuntary (failed payments, expired cards), your retention strategies will differ from those you would use if your churn were primarily voluntary.
Acceptable churn vs. critical churn: where is the line?
| Segment | Green Zone | Orange Zone | Red Zone |
| SMB self-service | < 3% per month | 3 to 7% per month | > 7% per month |
| Assisted SMB | < 2% per month | 2 to 5% per month | > 5% per month |
| Mid-market | < 1.5% per month | 1.5% to 3% per month | > 3% per month |
| Enterprise | < 0.5% per month | 0.5% to 1.5% per month | > 1.5% per month |
What the best SaaS companies do to stay below the benchmarks
SaaS companies that maintain a churn rate below the industry average share three common practices:
- They detect issues early. They identify warning signs 30 to 90 days before a contract is terminated, when there is still time to take action.
- They act quickly. Once a signal is detected, they respond within 24 to 48 hours with the right message and value proposition.
- They track everything. They know exactly where their churn comes from (segment, acquisition channel, tenure, type of signal) and make continuous adjustments.
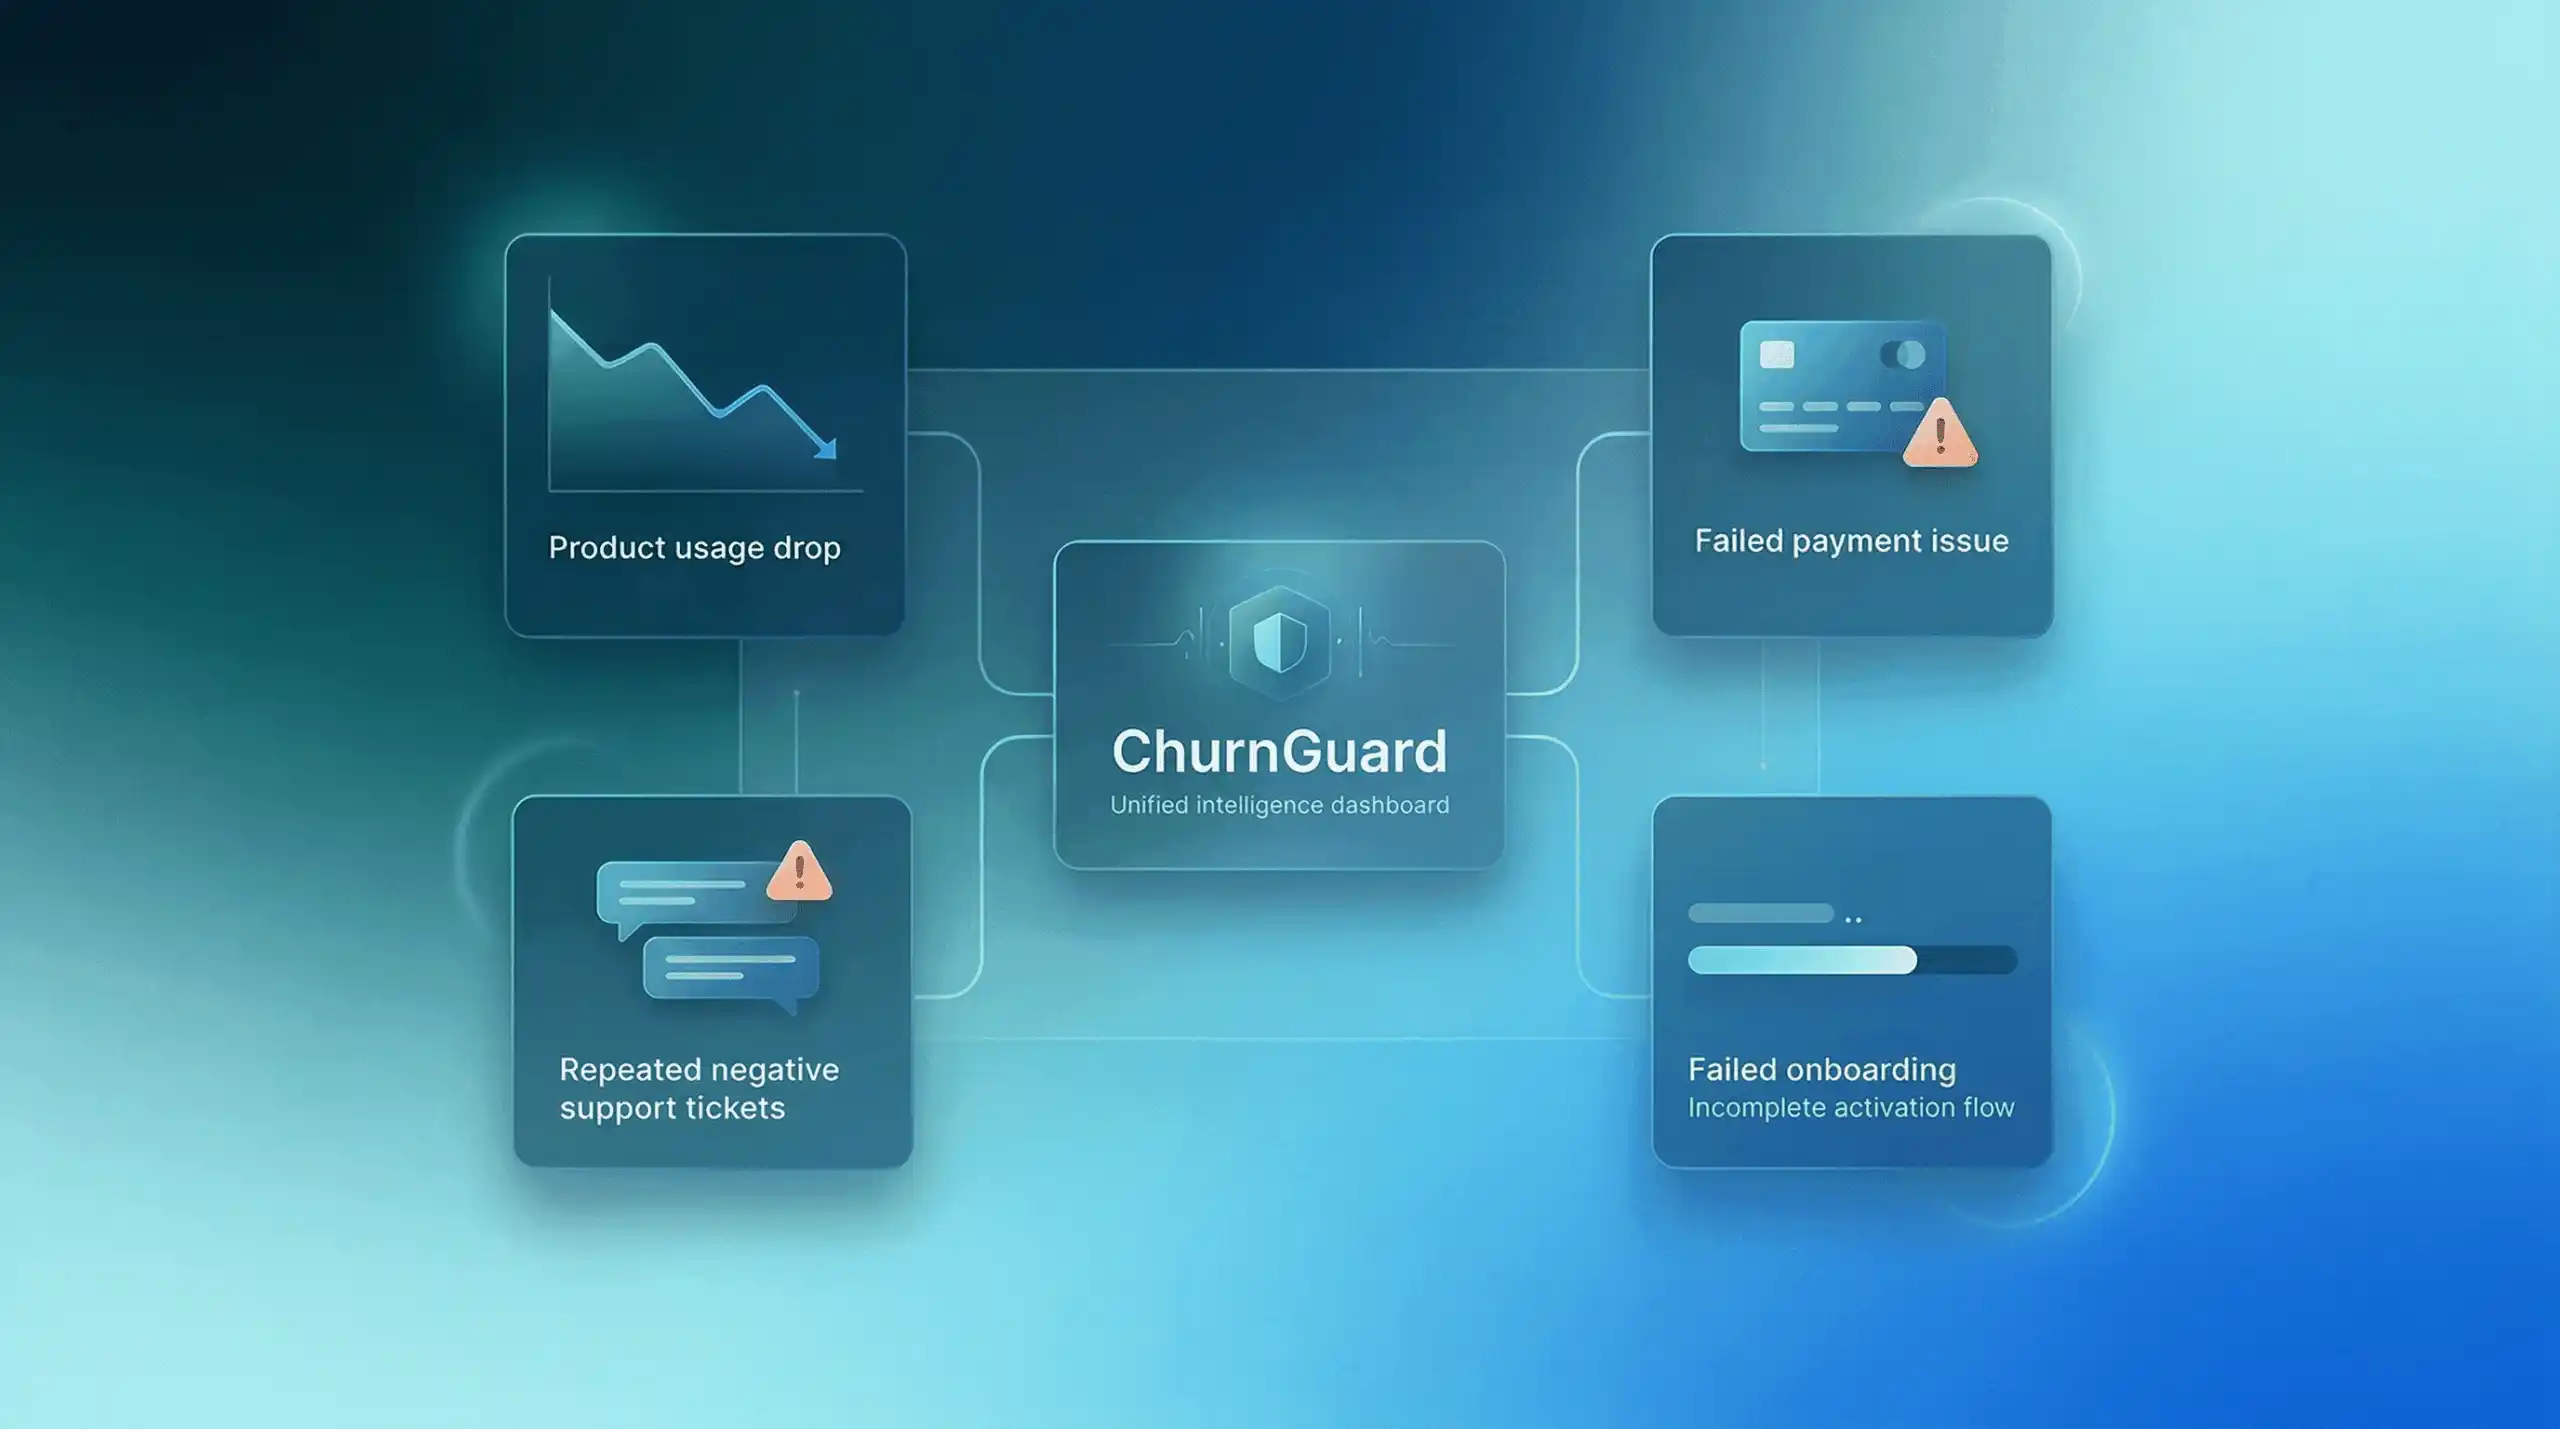
That’s exactly what ChurnGuard does: connect your billing system, product database, and support tool in just a few minutes, and ChurnGuard automatically identifies your at-risk customers, ranks them by urgency, and tells you what to do to maximize your chances of retaining them.
Conclusion
The average churn rate for a SaaS company cannot be viewed in isolation. A monthly churn rate of 5% might be excellent for an early-stage SMB SaaS company, but disastrous for an enterprise SaaS company in the scaling phase. What matters is comparing your churn rate to the right benchmarks, understanding the factors that influence it, and knowing exactly when to sound the alarm.
If your churn rate exceeds the green zones for your segment, check out our 5 key strategies for reducing churn in 2026.