This guide walks you through the initial setup of ChurnGuard step by step, from connecting your first tools to customizing your churn signals.
⏱ Estimated time: A few minutes to 15 minutes, depending on your plan and the integrations you need to connect.
Overview of Onboarding
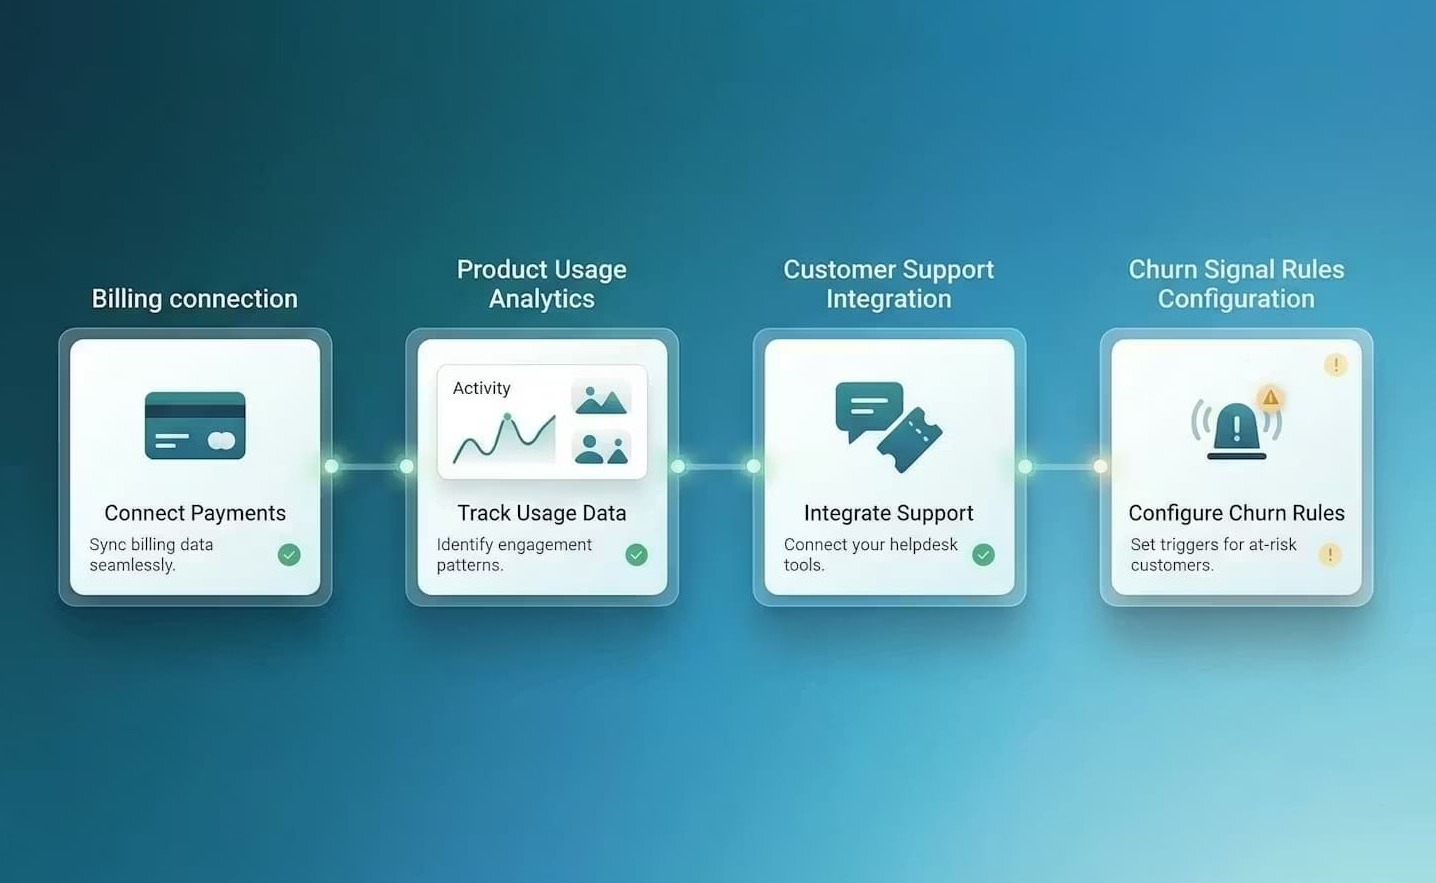
Setting up ChurnGuard involves four steps. Depending on your plan, some steps may be optional or unavailable.
| Step 1 | Connect your billing tool — required for all plans |
| Step 2 | Connect your Usage tool — Pro & Business plans |
| Step 3 | Connect your Support — Pro & Business Plans |
| Step 4 | Set up your alert rules — Pro & Business plans |
⚠️ Essential Plan: Only Step 1 (billing tool) is available. Steps 2, 3, and 4 are available when you upgrade to the Pro or Business plan.
1. Connect your billing tool
The billing tool is the only required integration. It enables ChurnGuard to detect failed payments, cancellations, refunds, and unpaid invoices.
How to connect your billing tool
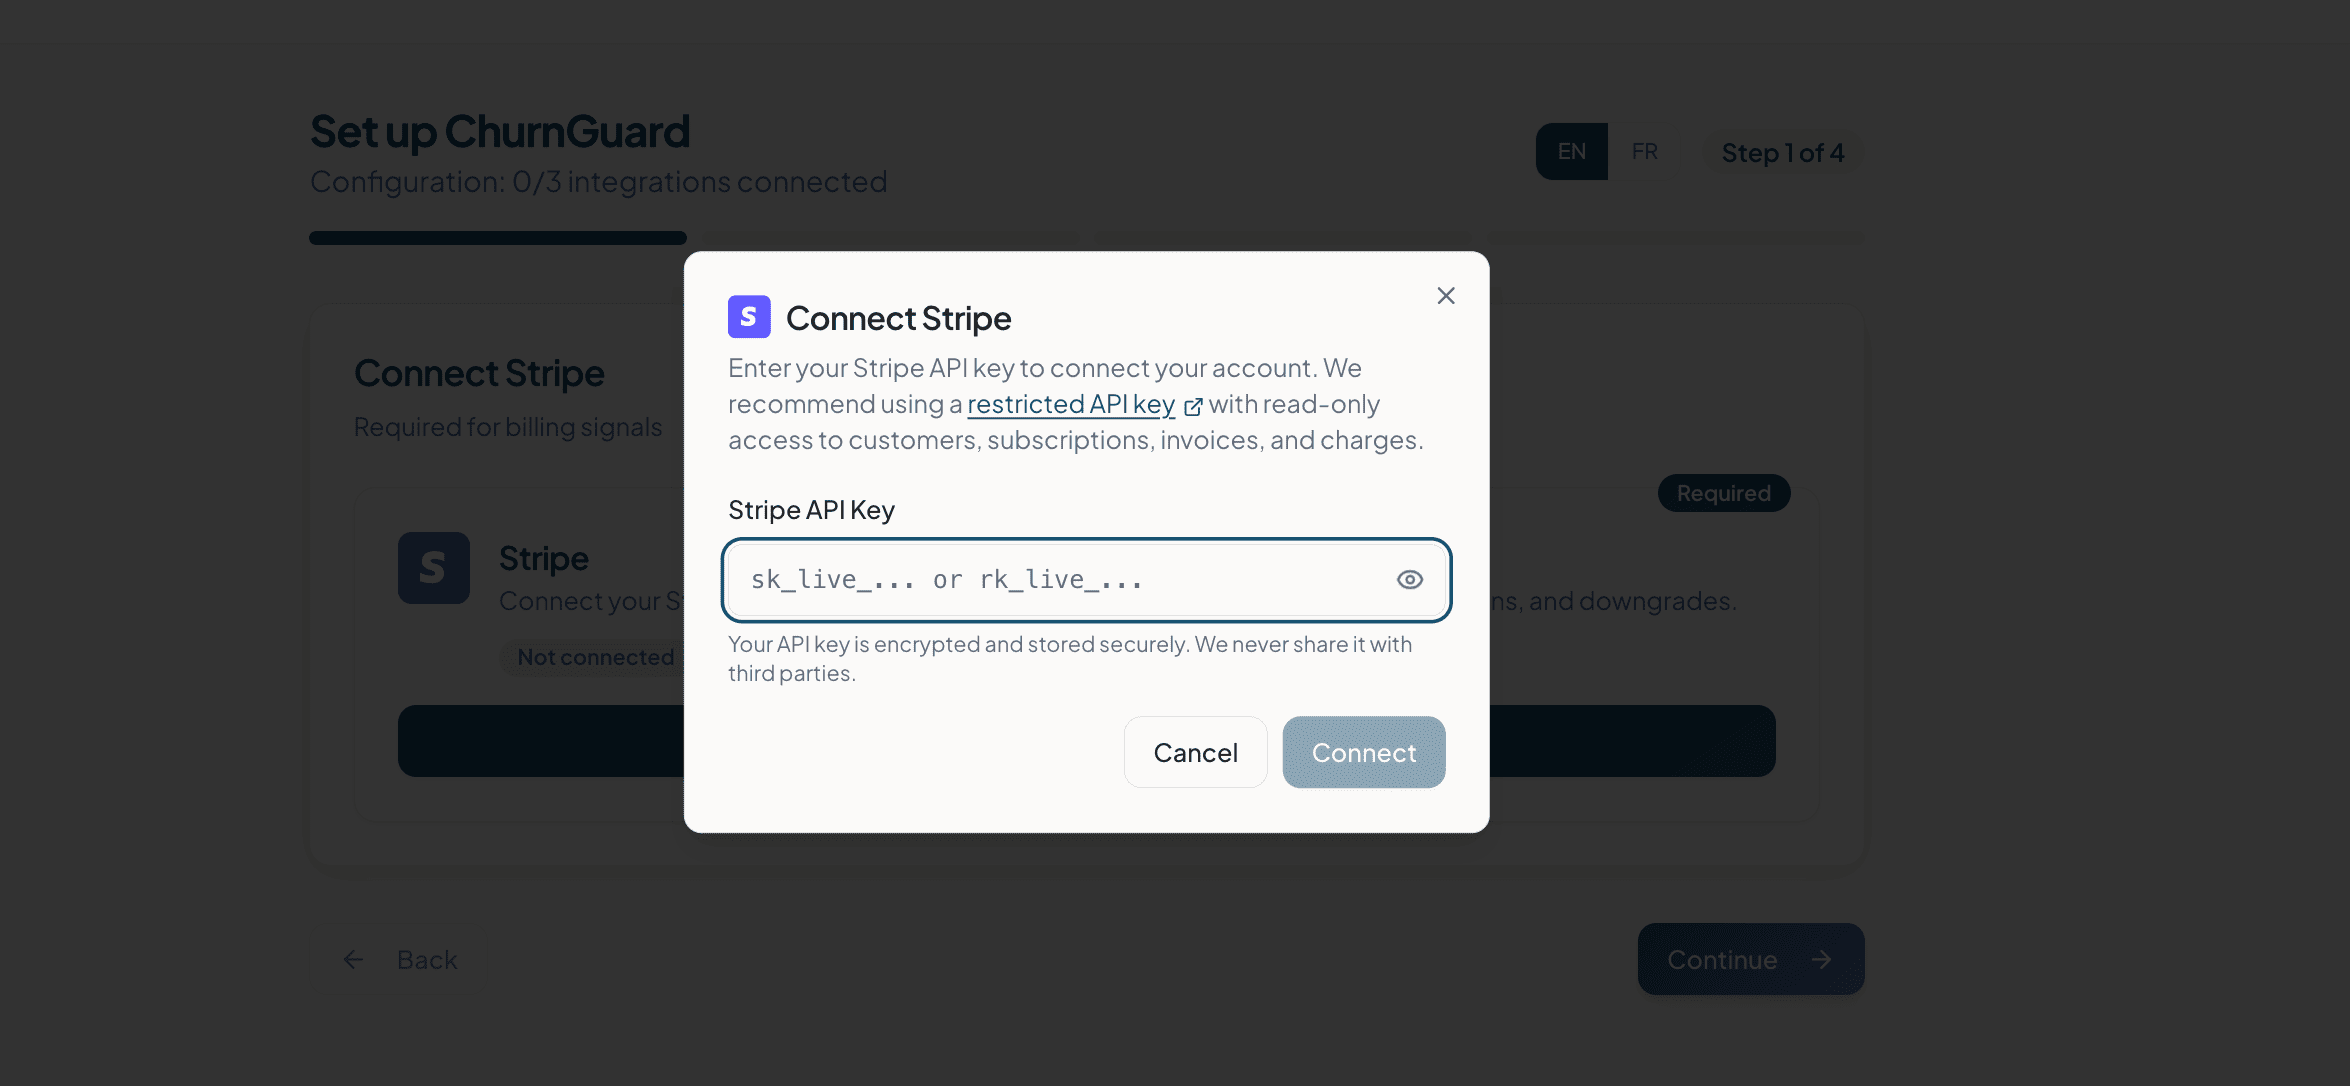
1- On the configuration screen, click Connect next to Stripe.
2- A window will open asking for your Stripe API key.
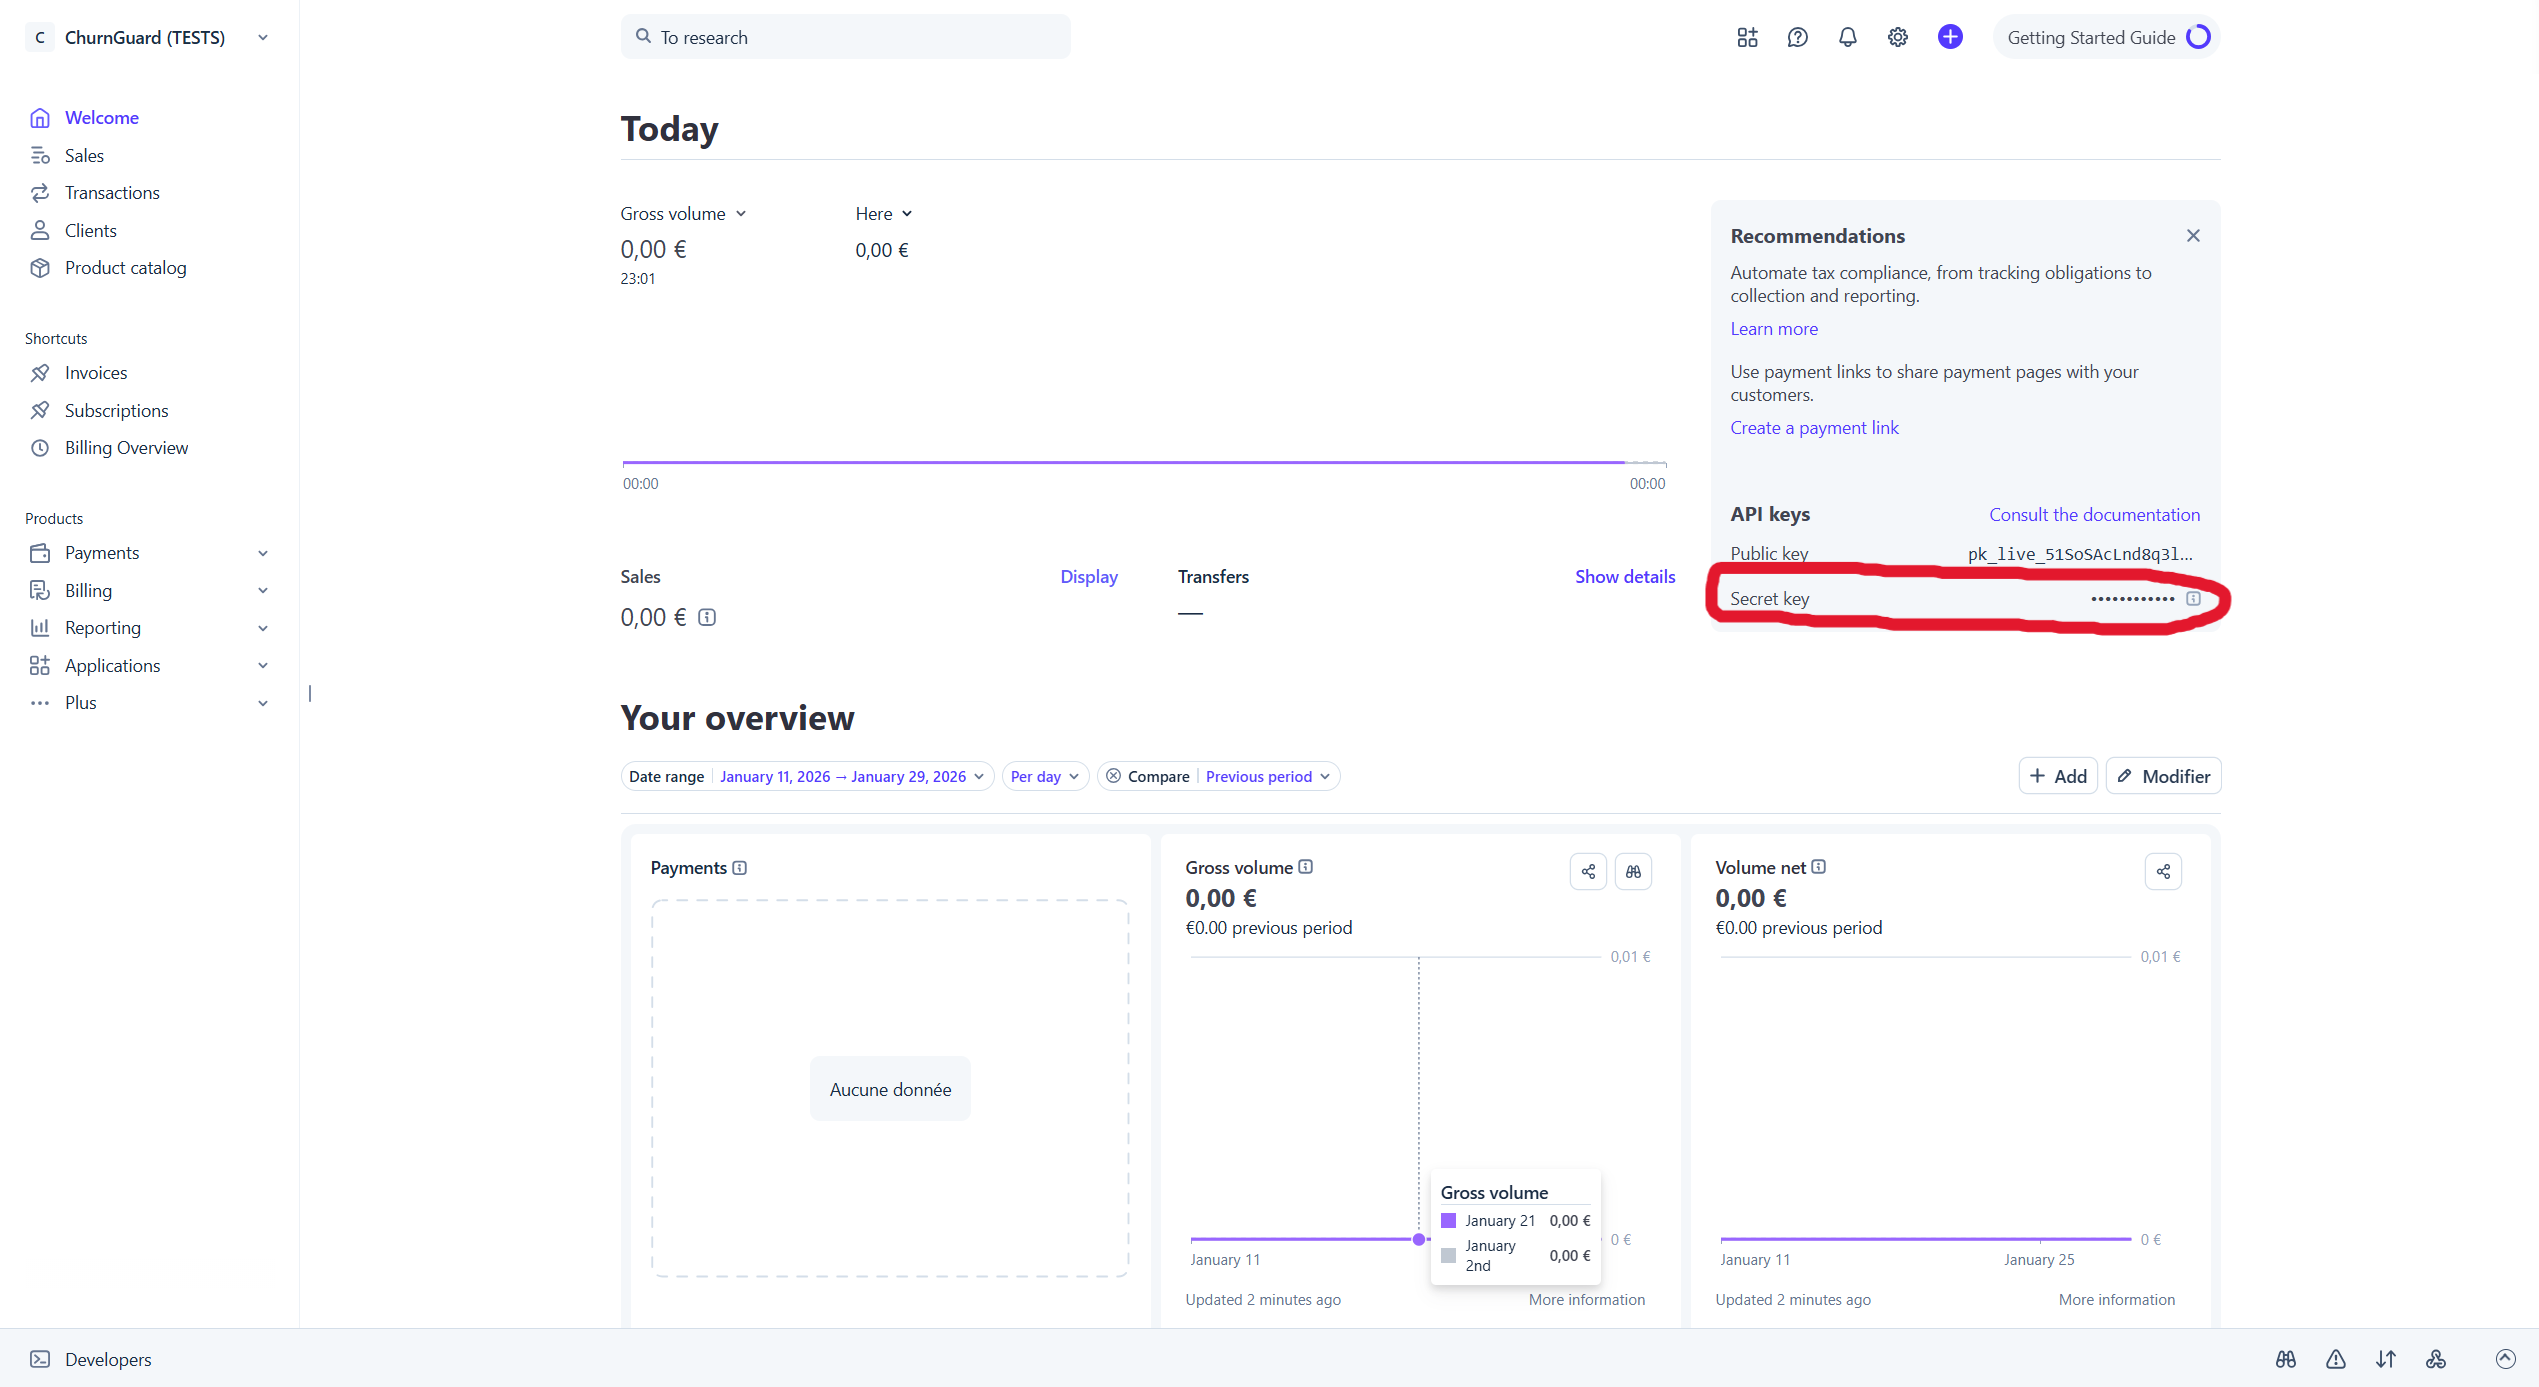
3- In your Stripe Dashboard, locate and copy your API key
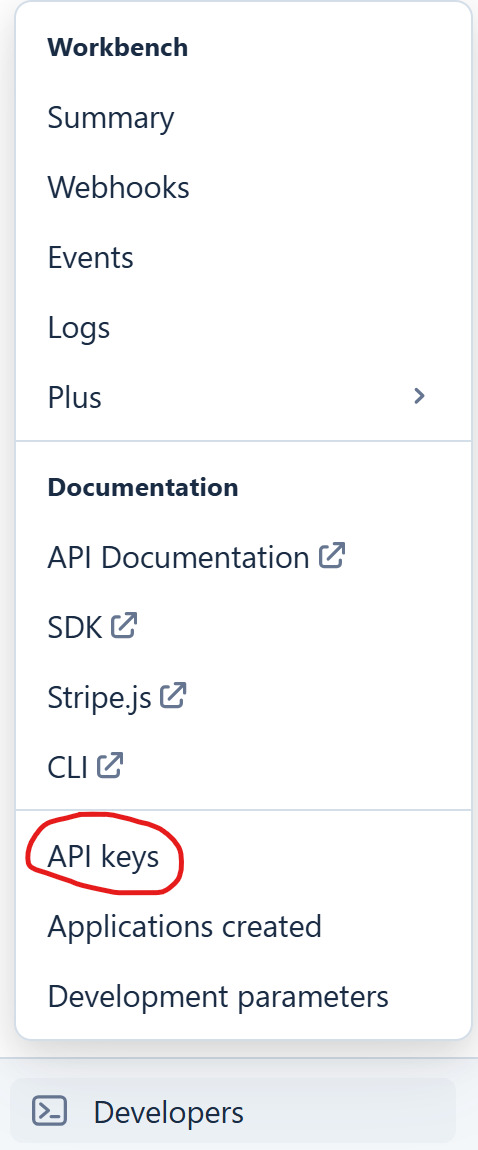
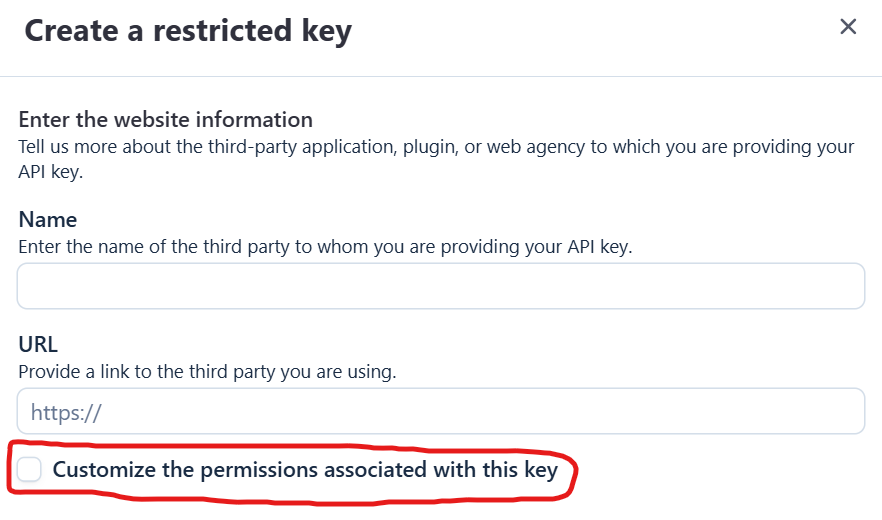
If you prefer, you can go to Developers and create a restricted API key.
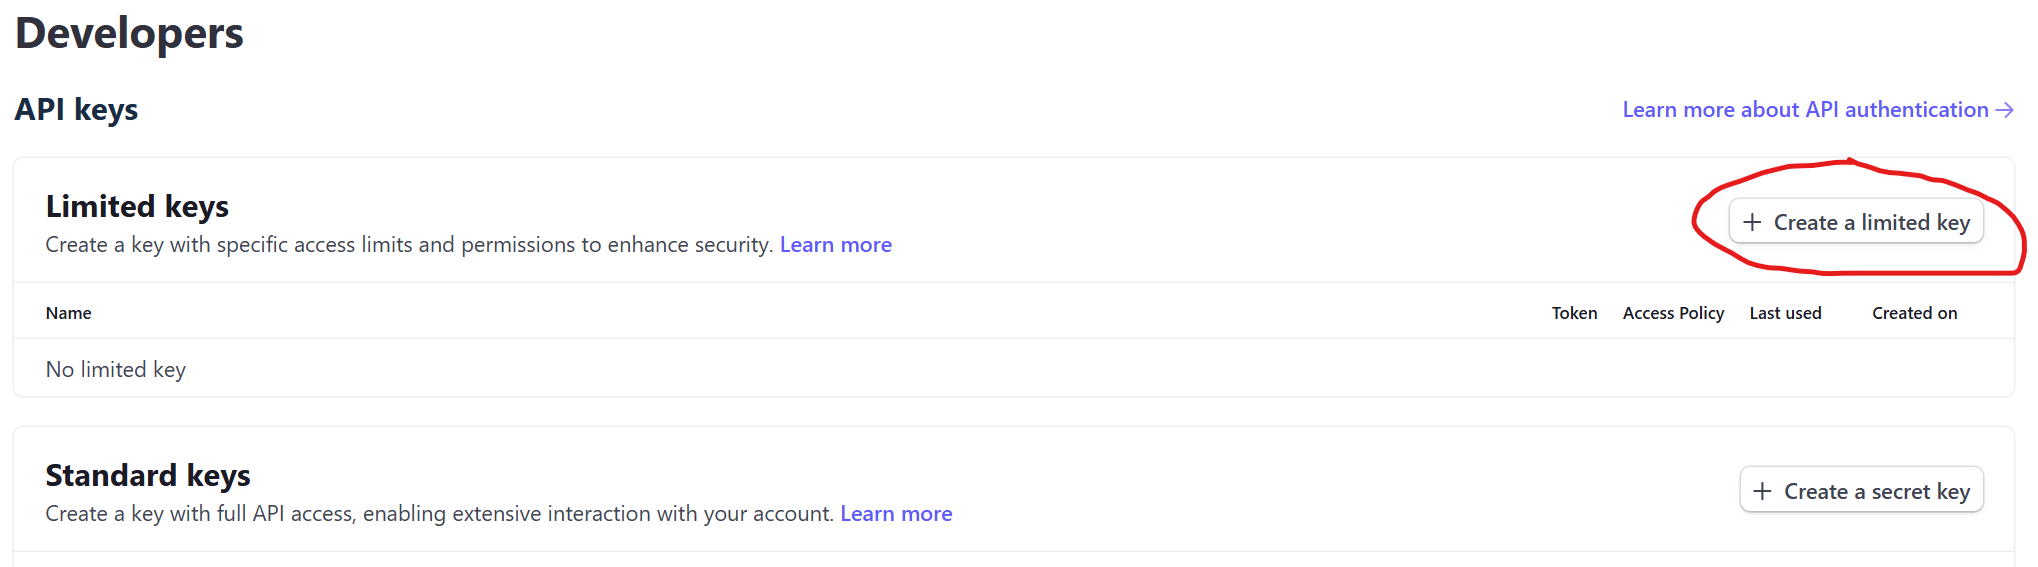
⚠️ WARNING:
Do not check the box labeled “Customize permissions for this key.
” If you still want to customize permissions, you must select at least the following:
- “READ ONLY” for the following events: charge.succeeded, charge.refunded, customer.created/updated/deleted, customer.subscription.created/deleted/updated, invoice.paid, invoice.payment_failed, invoice.payment_succeeded, customer.deleted
- And “WRITE” for the “webhook_endpoint” event.

4- Copy the key (format sk_live_... or rk_live_...) and paste it into the Stripe API Key field in ChurnGuard.
5- Click Connect. The connection is confirmed immediately.
✅ Your API keys are encrypted and stored securely. ChurnGuard never shares them with third parties.
What happens next?
Once Stripe is connected, ChurnGuard immediately begins receiving billing events. The first signals will appear in your dashboard within minutes.
If you’re on the Essential plan, you’re all set. Click Continue to access your dashboard.
2. Connect your usage tool
This step allows ChurnGuard to track your users’ activity within your product: logins, key actions, and completion of the onboarding process. Two integrations are available.
⚠️ This step is optional. If you aren't tracking product usage yet, you can skip it and set it up later under Settings > Integrations.
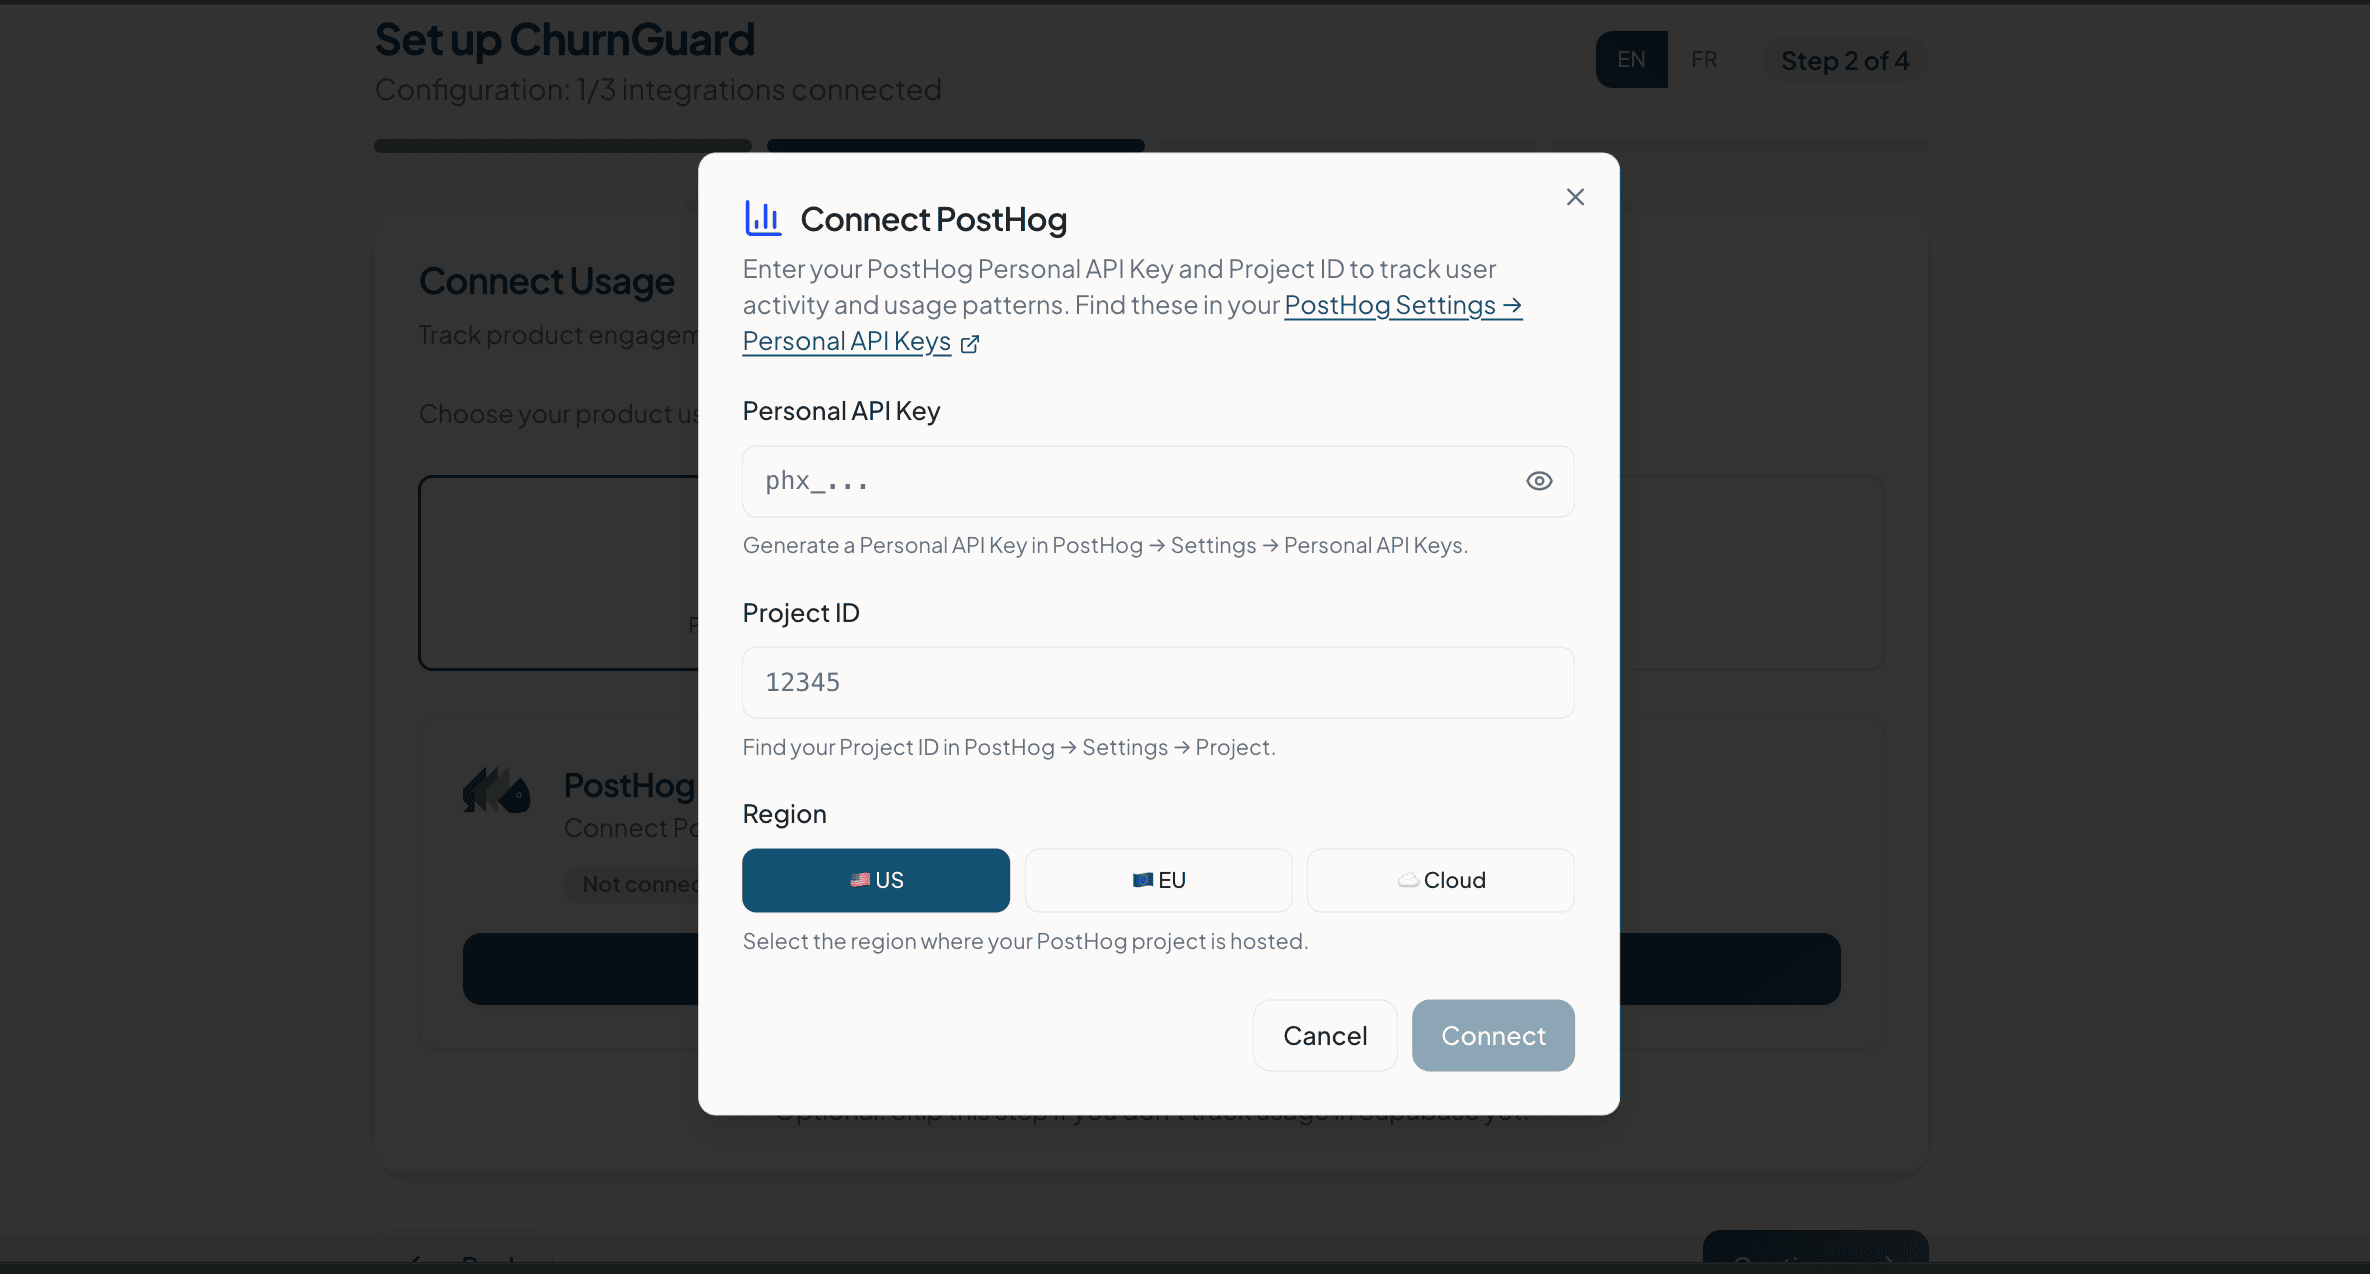
Option A — PostHog
PostHog is a product analytics tool. Select this option if you use PostHog to track user events.
1. Select PostHog from the Usage integrations list.
2- Click Connect. A window will open.
3- In PostHog, go to Settings > Personal API Keys and create a new personal key.
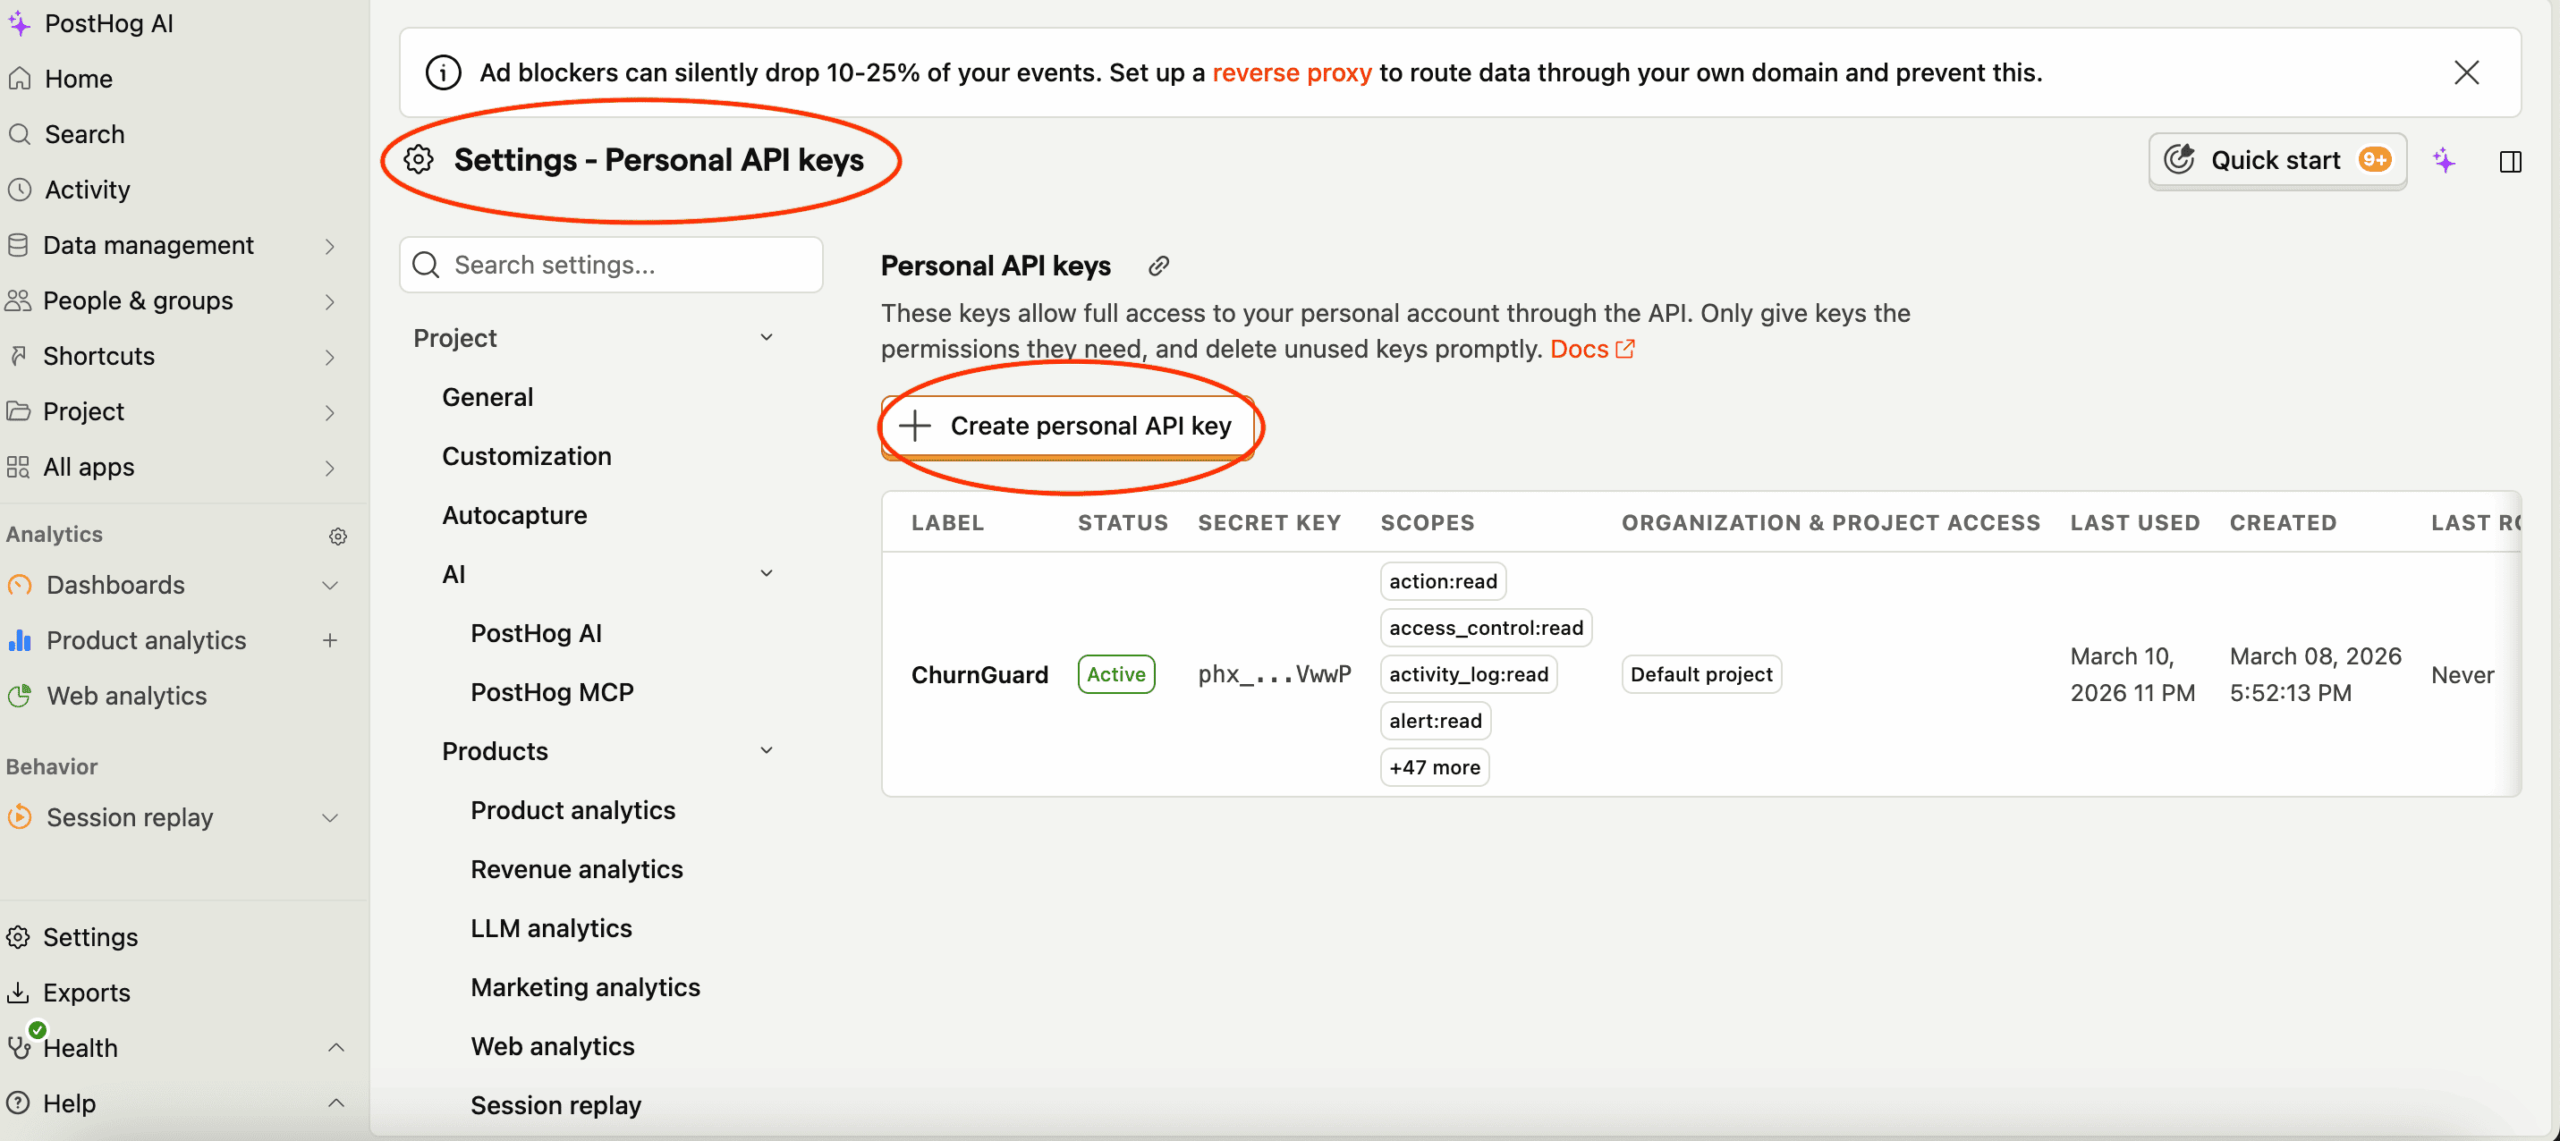
4- In the Label field, name your key ChurnGuard so you can easily find it.
Under Organization & project access, select All access.
In the Scopes section, set the following permissions to Read only: Event definition, Person, Query, Property definition. Leave all other scopes set to No access.
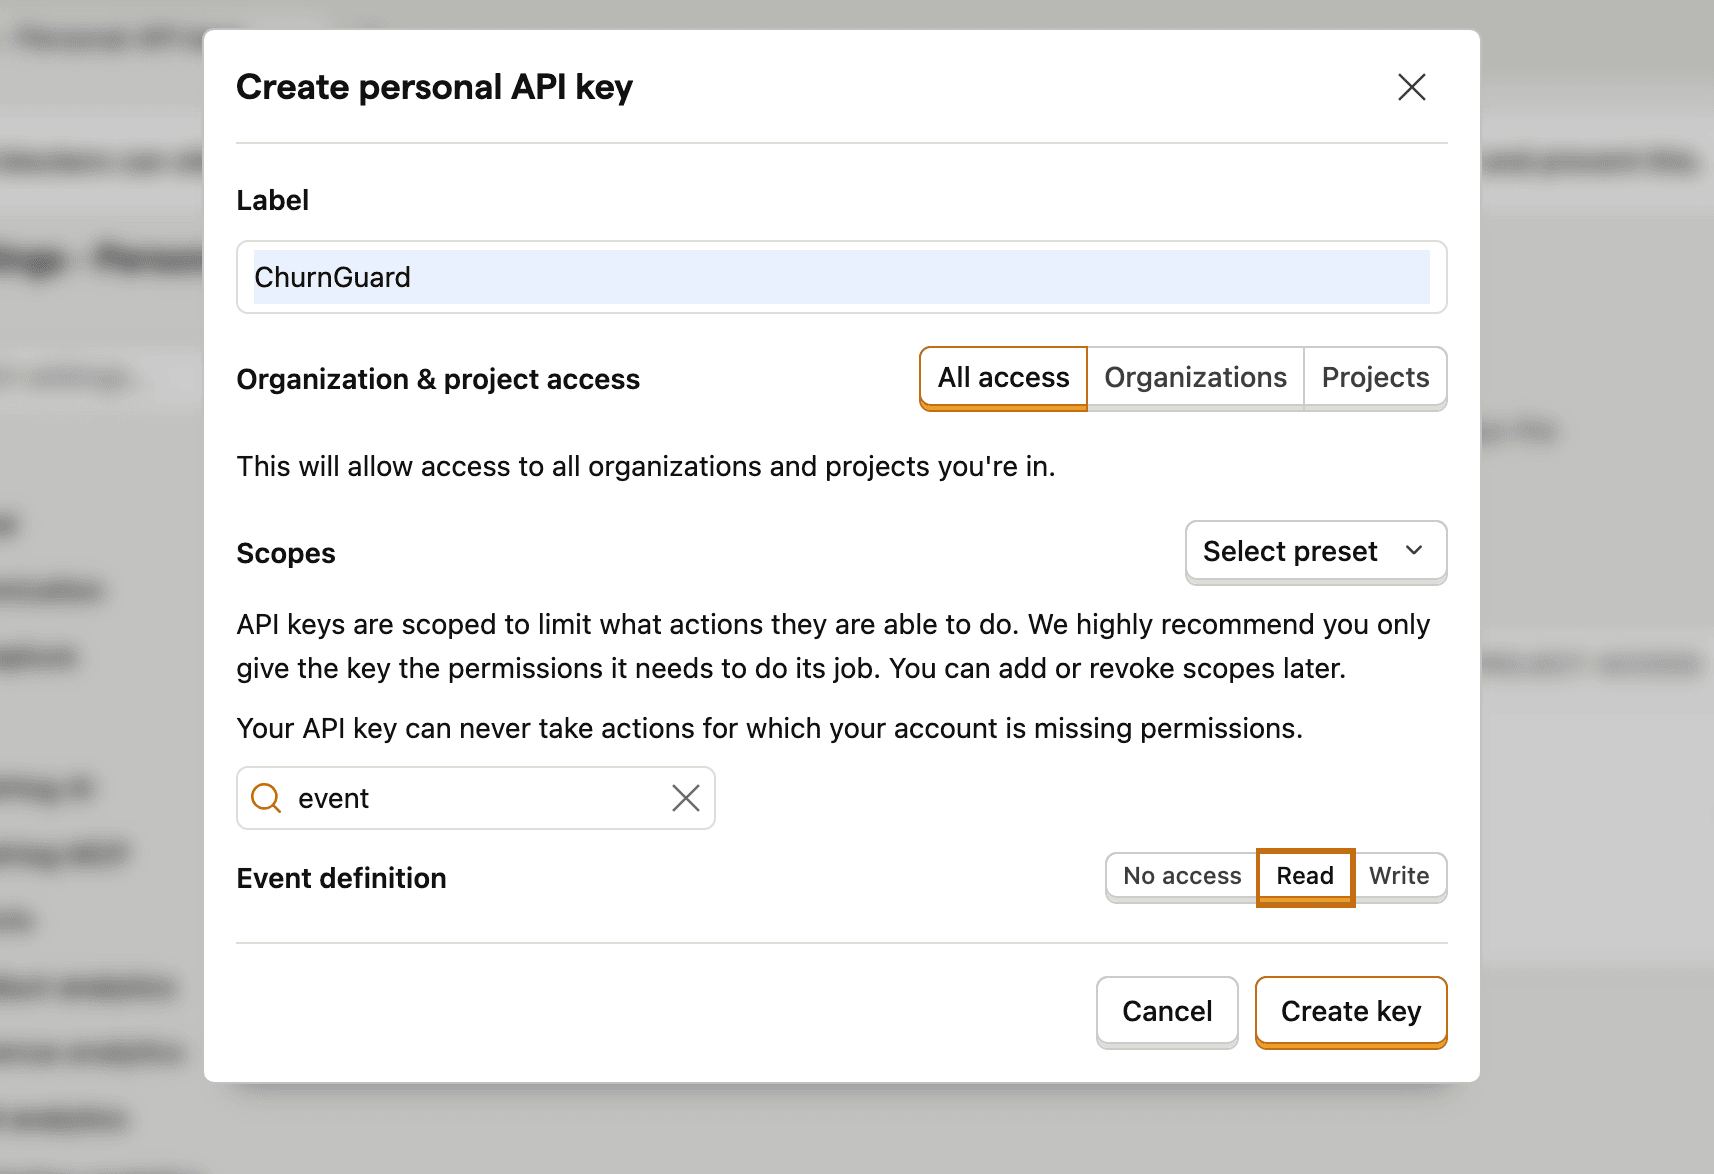
5- Click Create key. The key is displayed only once: copy it immediately.
6- Copy the key (in phx_...) and paste it into the Personal API Key field.
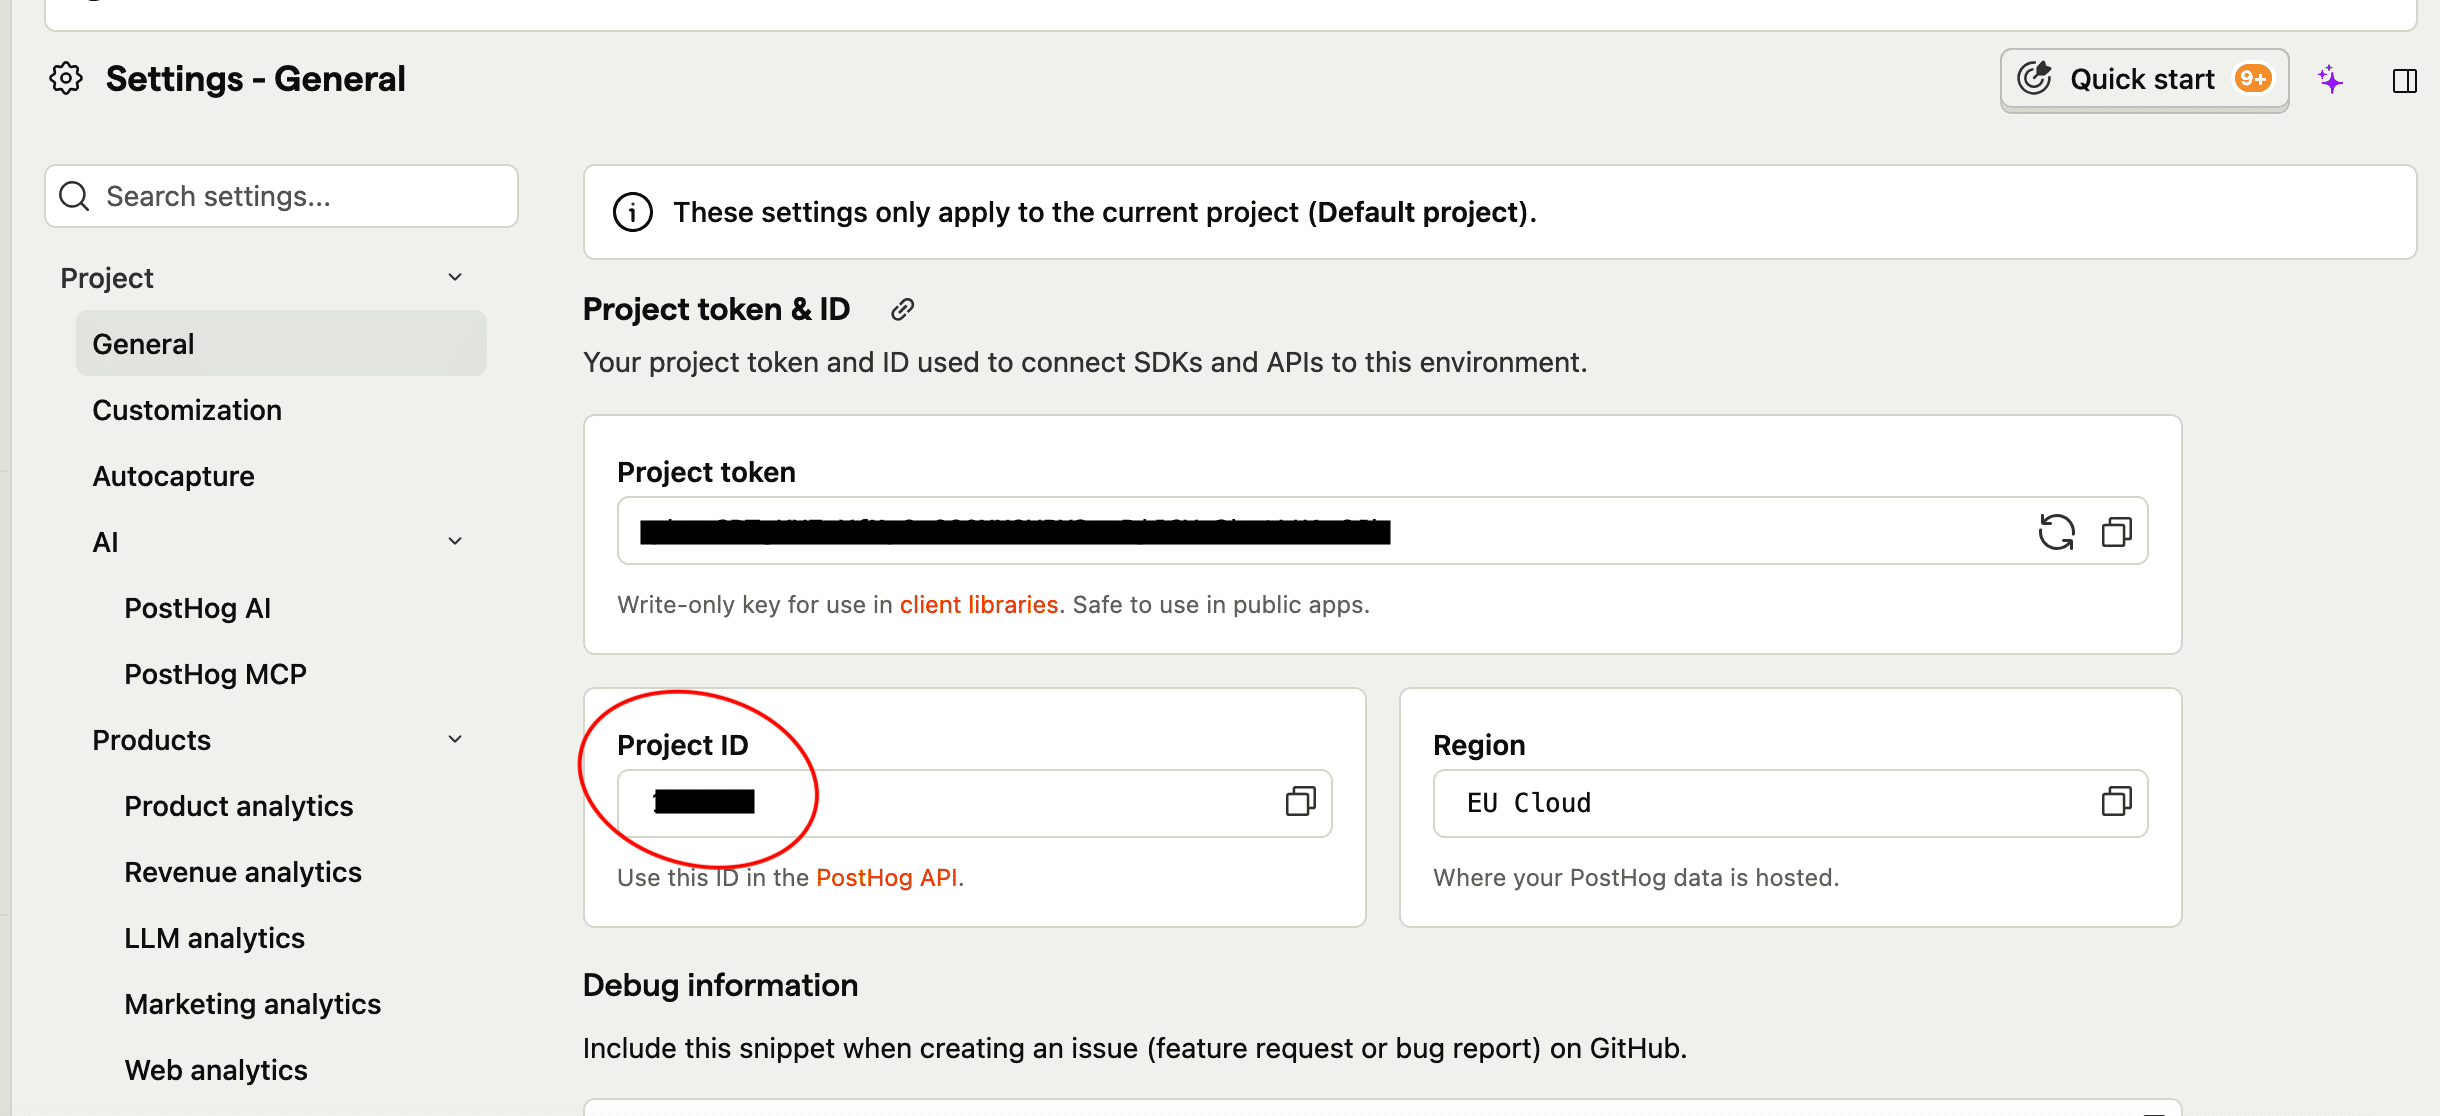
7- Enter your Project ID, which can be found in PostHog > Settings > Project.
8. Select your region: US, EU, or Cloud (usually EU)
9. Click Connect.
Option B — Supabase
Supabase is a database and authentication tool. Select this option if you use Supabase to manage your users.
1. Select Supabase from the Usage integrations list.
2- Click Connect. A window will open.
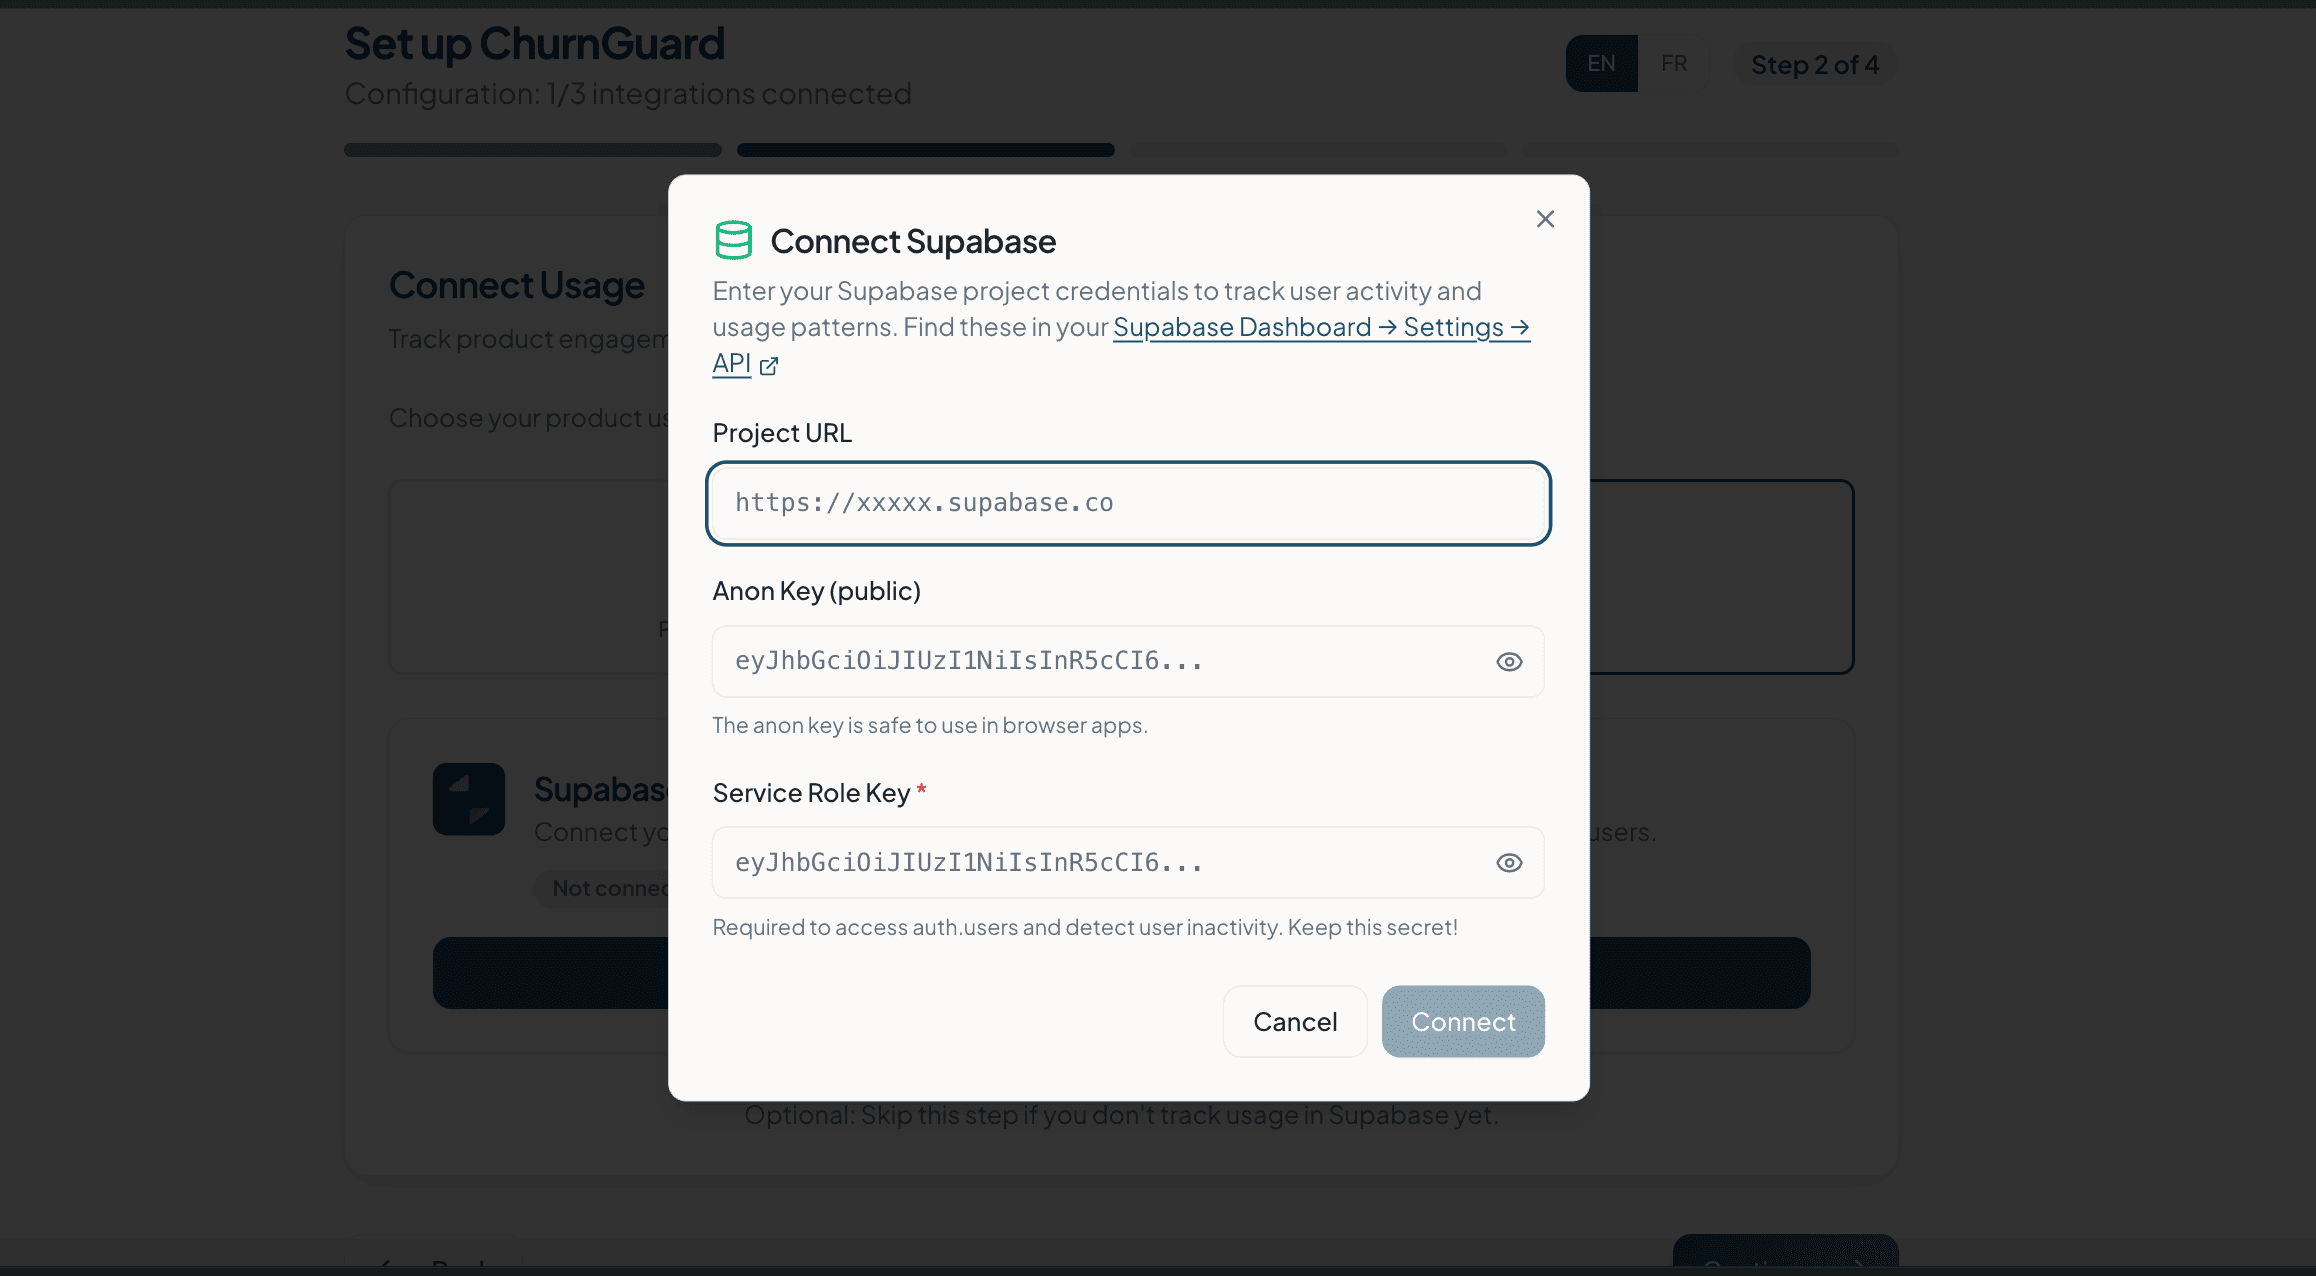
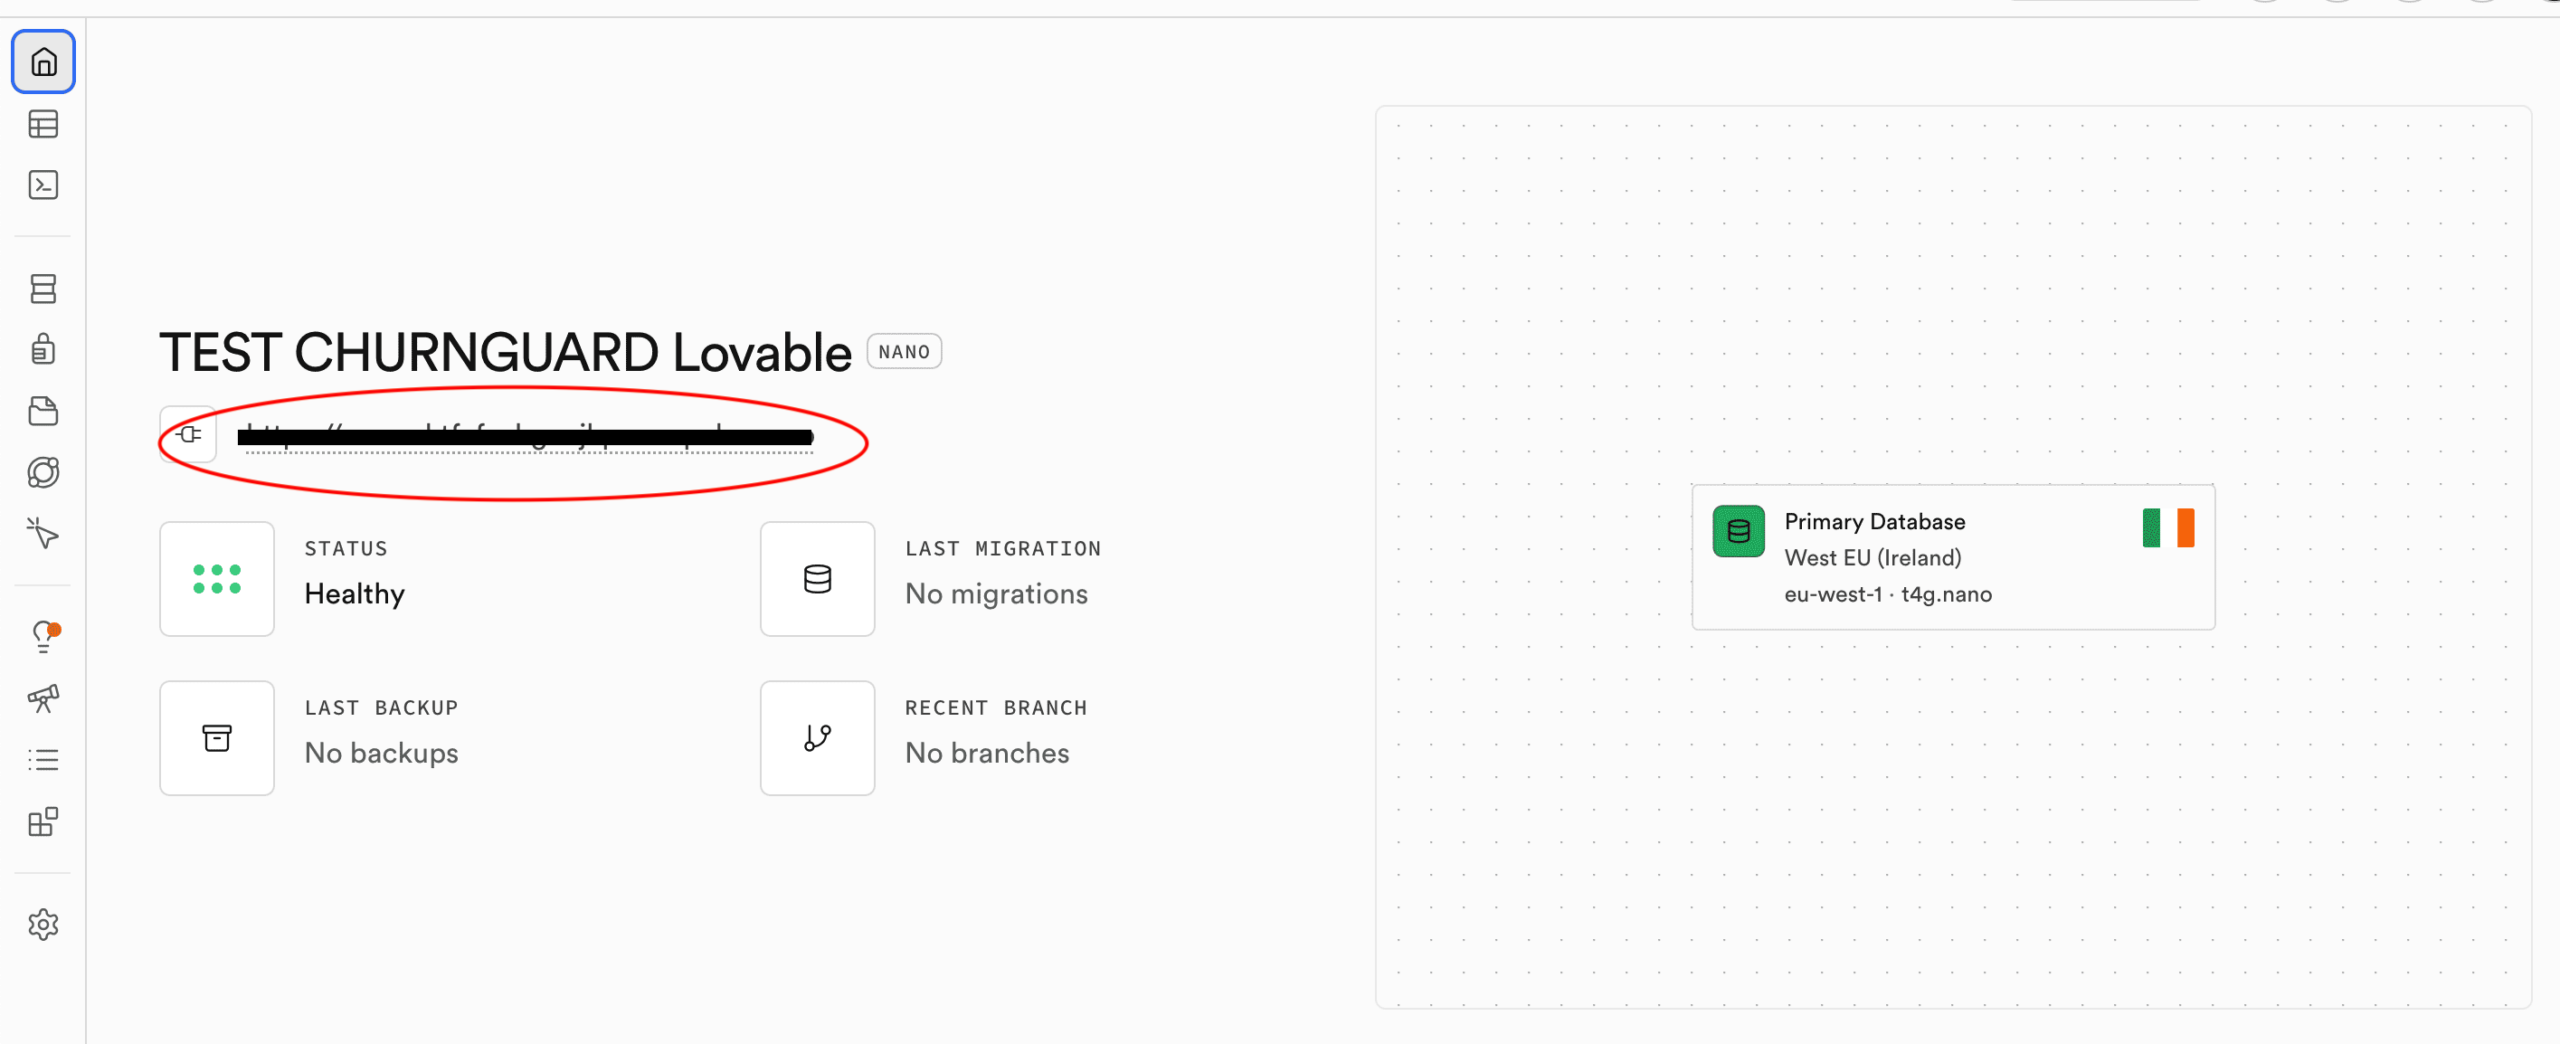
3- In your Supabase Dashboard, go to Project Overview. Copy your Project URL and paste it into the corresponding field.
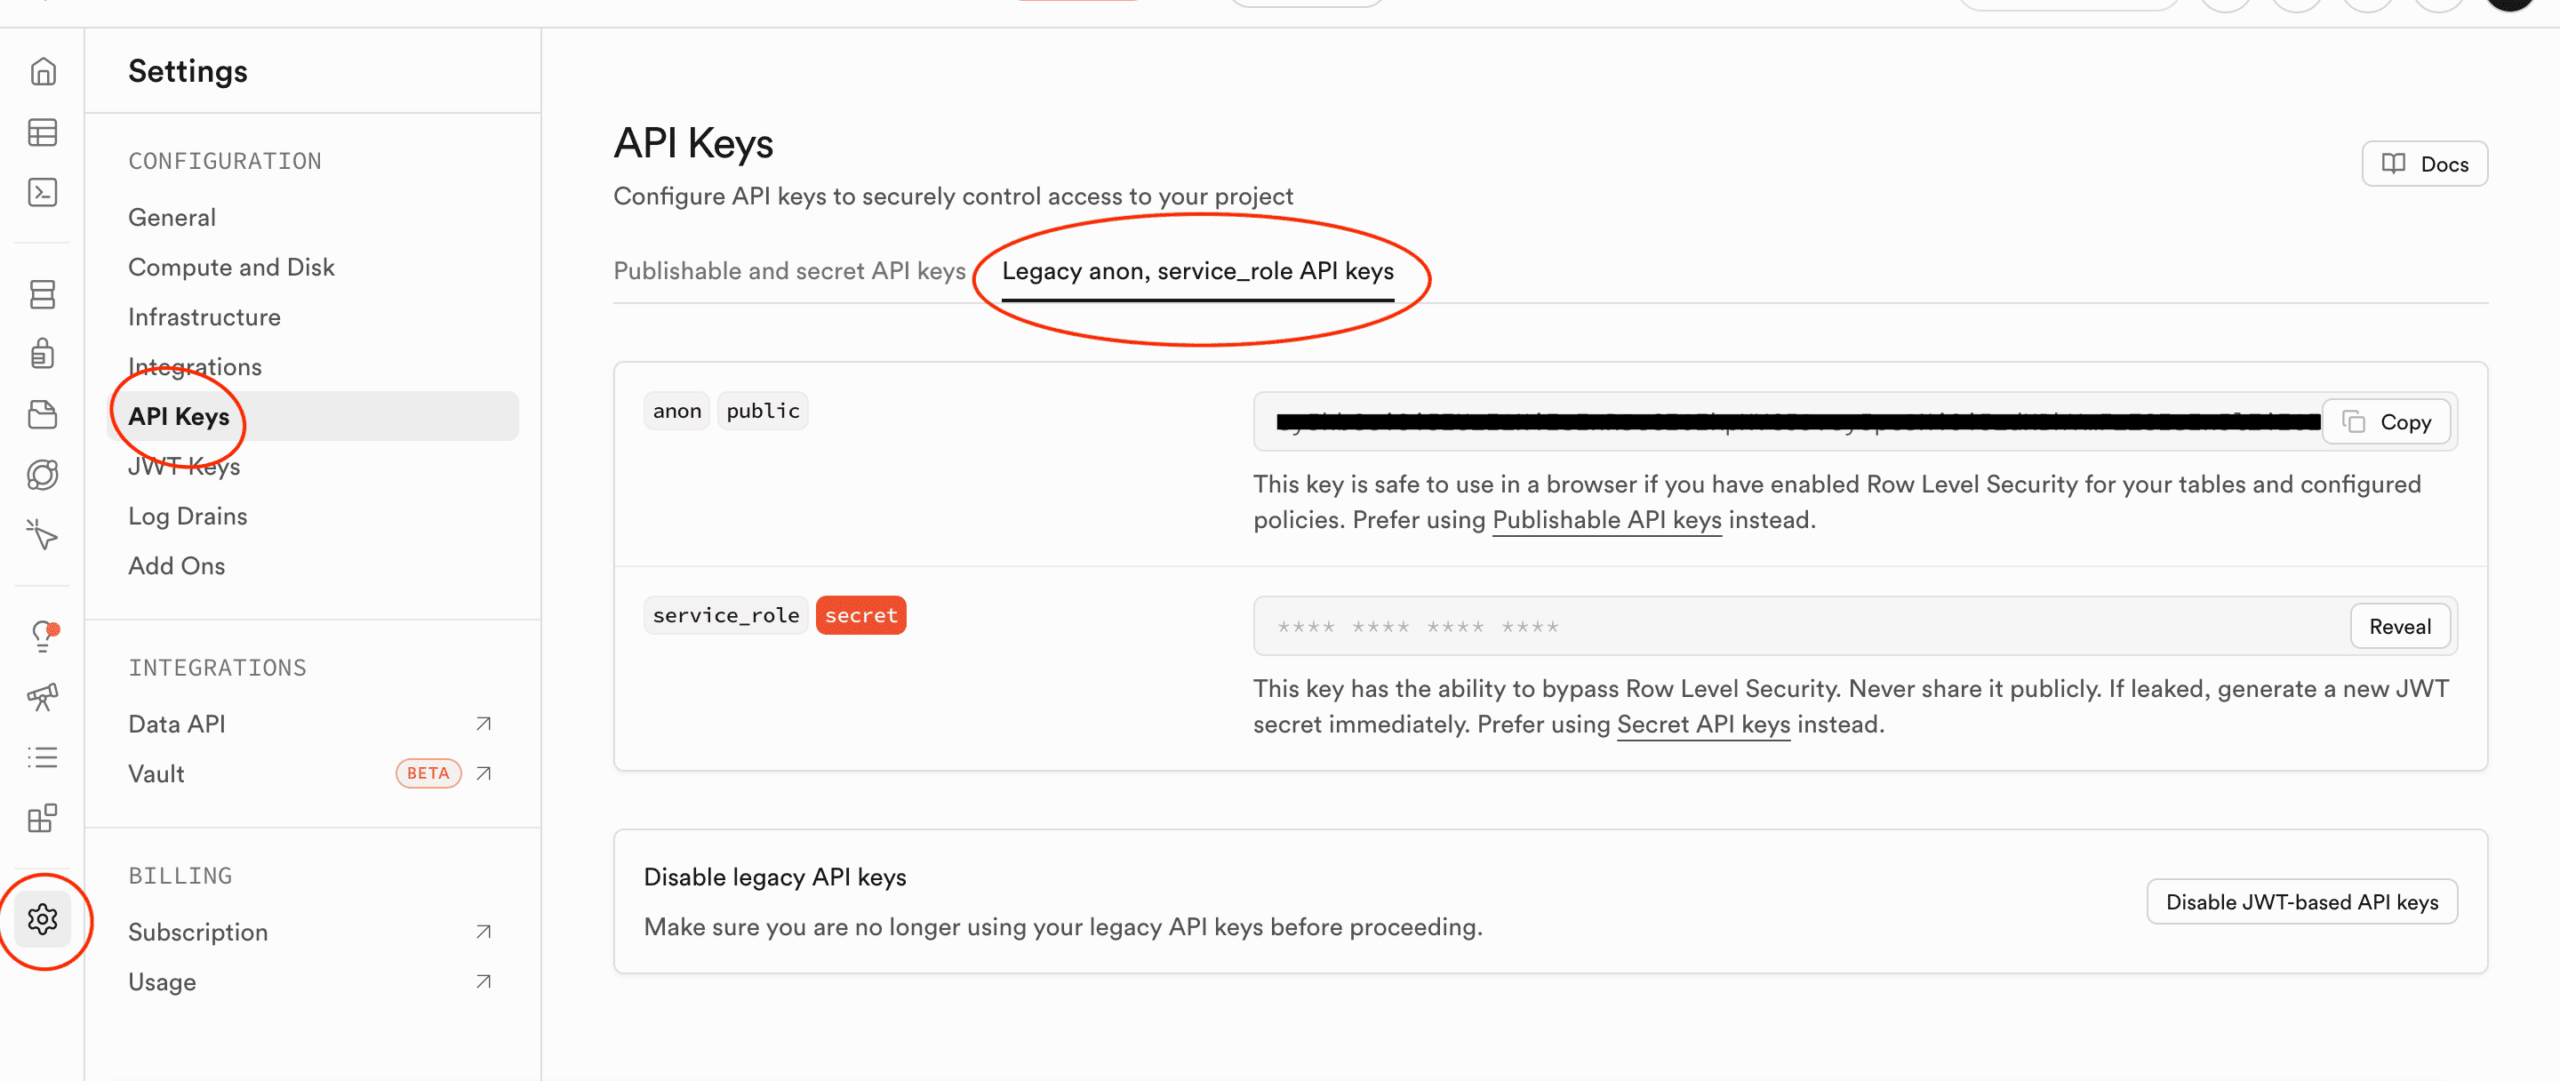
4- Next, go to Settings > API. Copy your Anon Key (public key) and paste it into the Anon Key field. Copy your Service Role Key (private key) and paste it into the Service Role Key field. This key is required to detect user inactivity.
5- Click Connect.
3. Connect your support tool
This step allows ChurnGuard to analyze your customers’ support tickets and emails to detect signs of dissatisfaction or disengagement. Two options are available.
⚠️ This step is optional. You can skip it if you don't want to track support signals at this time.
Option A — Email support (Gmail, Outlook, others)
Works with any email provider. ChurnGuard provides a unique forwarding address to which you can forward a copy of your support emails.
1. Select “Email” from the list of Support integrations.
2- Click Connect. ChurnGuard generates a unique forwarding address.
3- Copy this address (format support-xxxxx@inbound.churnguard.fr).
Setup instructions for your email provider:
Gmail: Settings > See all settings > Forwarding and POP/IMAP > Add a forwarding address > paste the ChurnGuard address > confirm > enable forwarding.
Outlook: Settings > See all Outlook settings > Mail > Forwarding > enable > paste the ChurnGuard address > save.
Other providers: Set up automatic forwarding to the ChurnGuard address through your provider’s settings. Check their documentation for specific instructions.
4- Once the transfer is set up, click Continue in ChurnGuard.
5- ChurnGuard asks you to verify the connection: send a test email to your support address from another email address. If the forwarding is set up correctly, ChurnGuard will receive it automatically.
§- Click “Verify connection.” If the verification is successful, the connection is confirmed.
Option B — Zendesk
Select this option if you use Zendesk as your ticketing tool. ChurnGuard connects directly to your account via API.
1. Select Zendesk from the list of Support integrations.
2- Click Connect. A window will open.
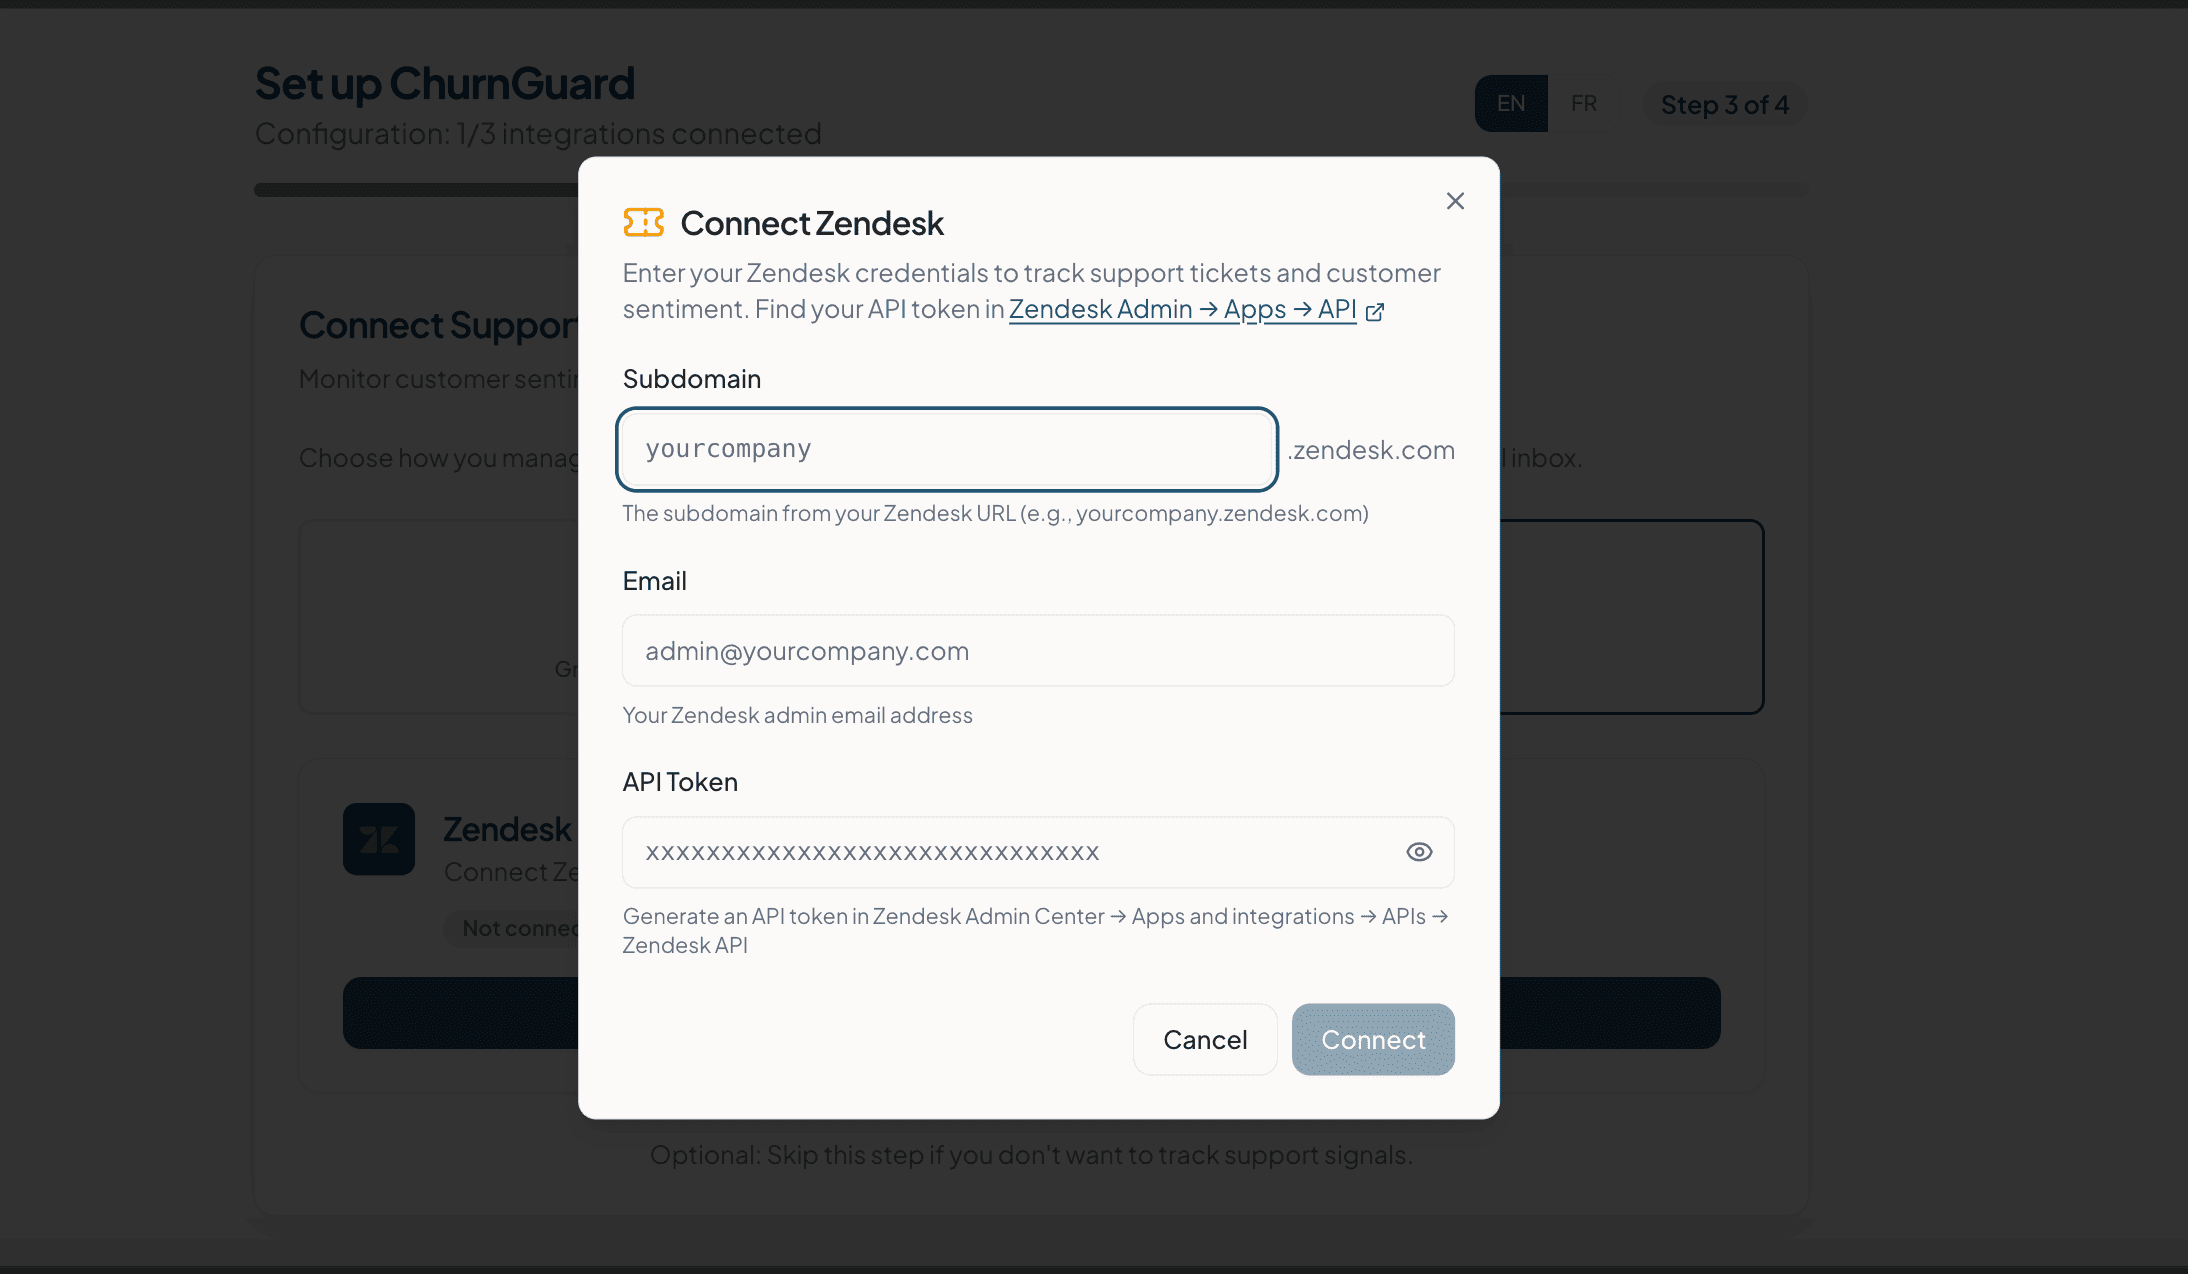
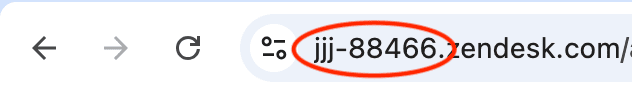
3- Enter your Zendesk subdomain (the part yourcompany visible yourcompany.zendesk.com visible in the page’s URL).
4- Enter the email address for your Zendesk administrator account.
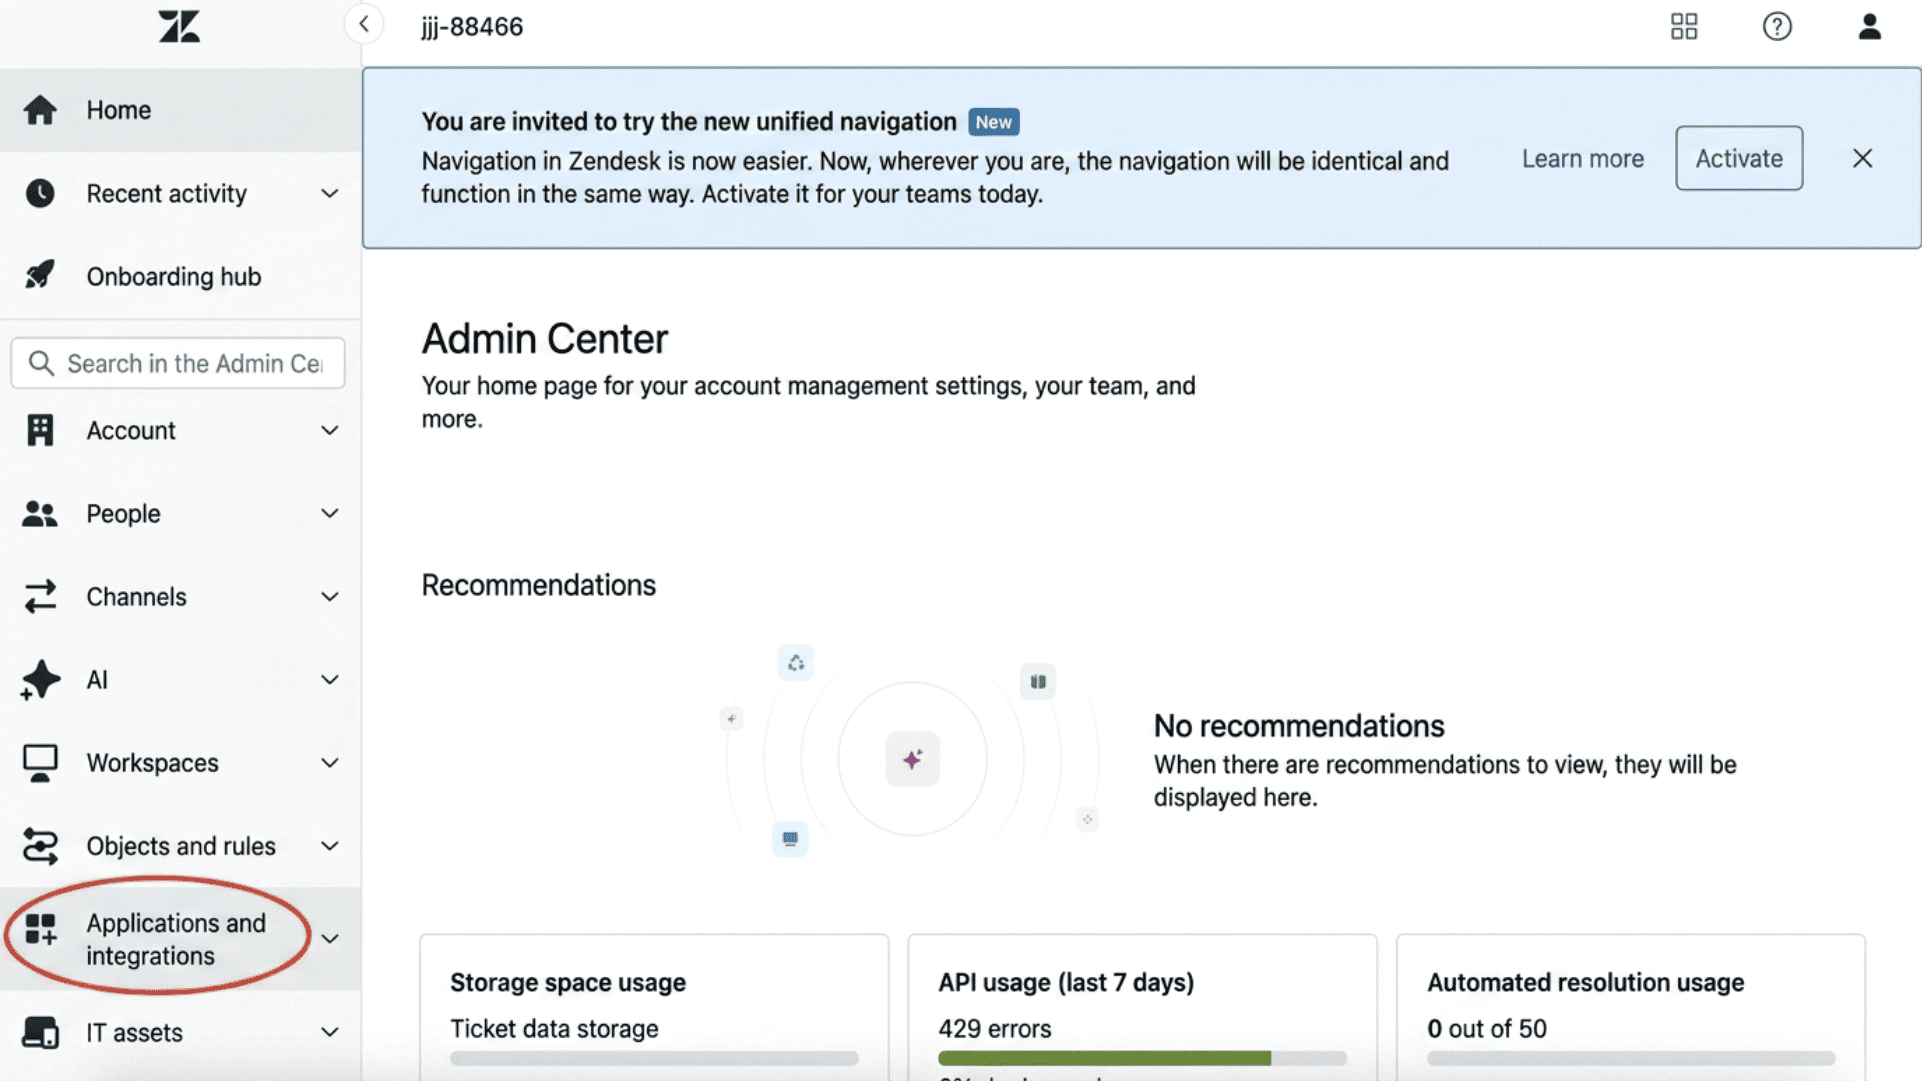
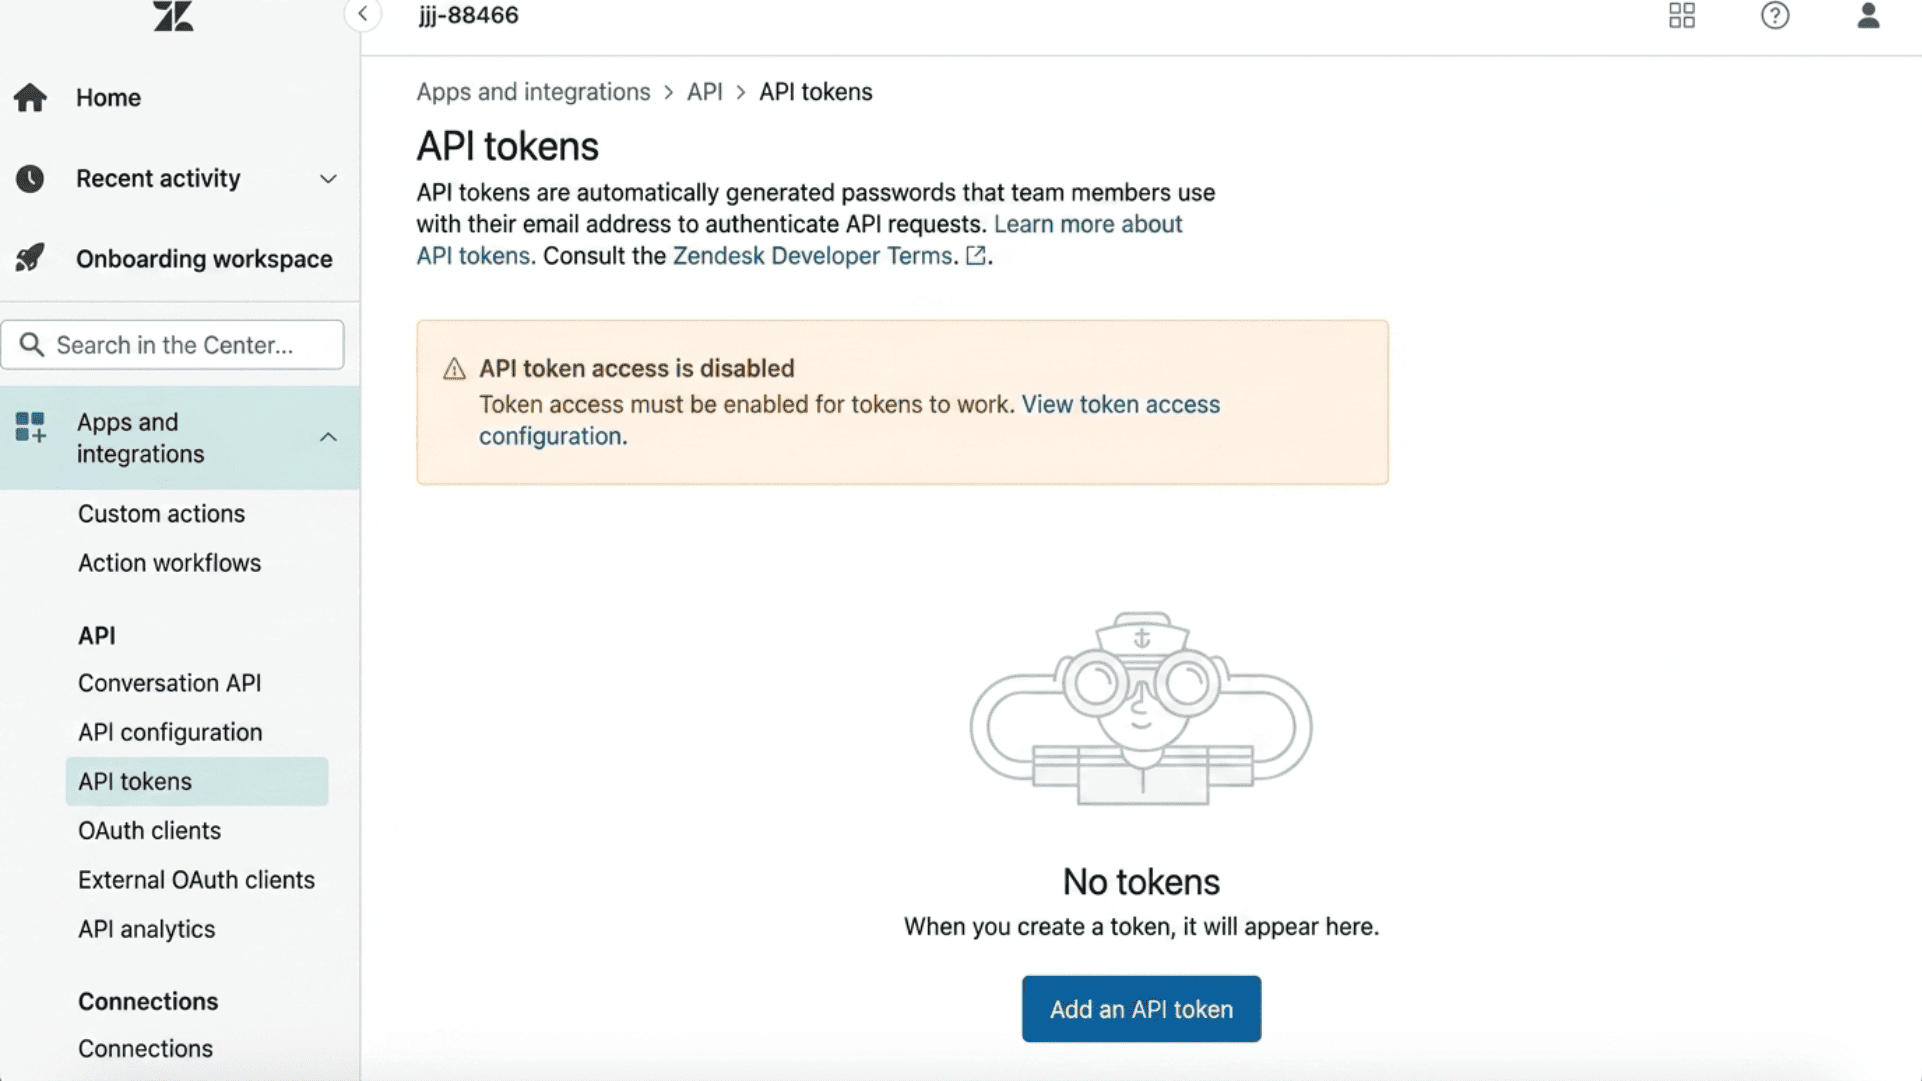
5. Generate an API token in the Zendesk Admin Center > Apps and integrations > APIs > API tokens.
6- Copy this token and paste it into the API Token field in ChurnGuard.
7- Click Connect.
4. Set up your signal rules
This is the final step of the setup. Here, you choose which churn signals ChurnGuard should detect and display in your dashboard. These rules can be edited at any time under Settings > Rules.
Signals available by category
Payment (Stripe)
- Payment failed — payment attempt failed
- Subscription canceled — the customer has canceled their subscription
- Refund issued — a refund has been issued
- Past due / Unpaid — overdue invoice or subscription marked as unpaid
Usage (PostHog or Supabase)
- Inactivity — no connection for X days (configurable threshold)
- Key action not performed — the user has not performed a key action in X days
Support / Email (Zendesk + email)
- Ticket surge — a sudden increase in the number of tickets (e.g., 2 tickets in 7 days)
- Negative ticket — negative sentiment detected in a support ticket
- Long ticket response time — initial response time exceeding 48 hours
- Email surge — increase in support emails (e.g., 2 emails in 7 days)
- Negative email — negative sentiment detected in a support email
How to set up your rules
- Check the alerts you want to enable. Payment alerts are checked by default.
- For the Usage and Support signals, adjust the thresholds based on your specific context (number of days of inactivity, number of tickets, etc.). These thresholds can be modified later.
- Click Continue to finish the setup.
💡 Recommendation: Start by enabling all Payment alerts and at least the Inactivity alerts under Usage. You can fine-tune the thresholds after monitoring the data for a few days.
Your setup is complete
ChurnGuard is now up and running! Your dashboard displays a real-time list of your at-risk customers, sorted by urgency level, along with the detected indicators and a recommended action for each one.
If you have any questions about setup or encounter a problem, please contact us or schedule a call directly for a live demo tailored to your tech stack.